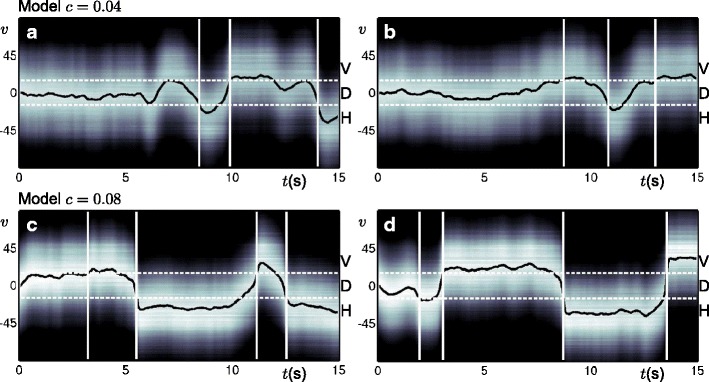
Fig. 9.

Time traces from individual model simulations where intensity shows the population activity across direction space (vertical axis). The solid black line is the average of this activity (average direction ) and the dashed lines indicate perception thresholds (PT) for detection of switches between the directions H and V; switches are indicated by vertical white lines. First and second rows shows examples from the low and high contrast cases, respectively
