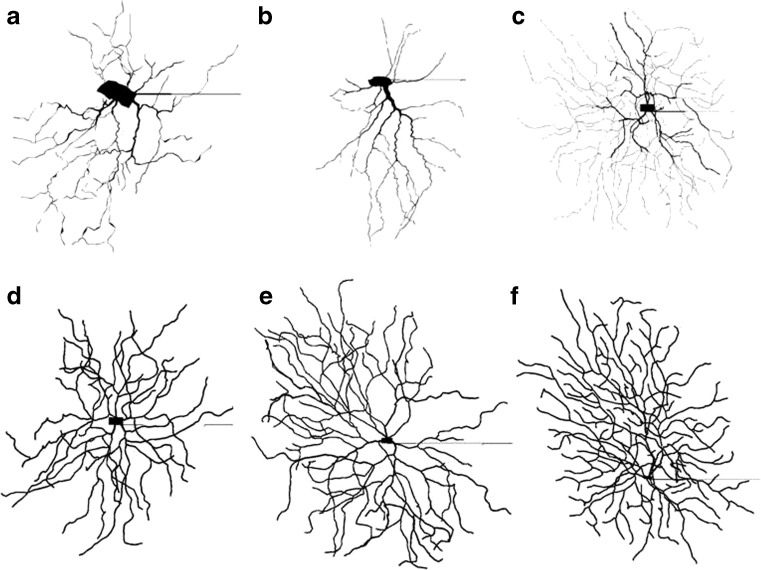
Fig. 1.
Plots of representative simulated RGC morphologies. Cells show different dendritic structures and soma sizes and shapes. a–c show cells that met model constraints, while d–f show cells that did not meet constraints (see Section 2.5). All cell figures were compiled using NEURON (Hines 1993) and adapted from the NeuroMorpho database (Ascoli et al. 2007; Coombs et al. 2006; Toris et al. 1995)

