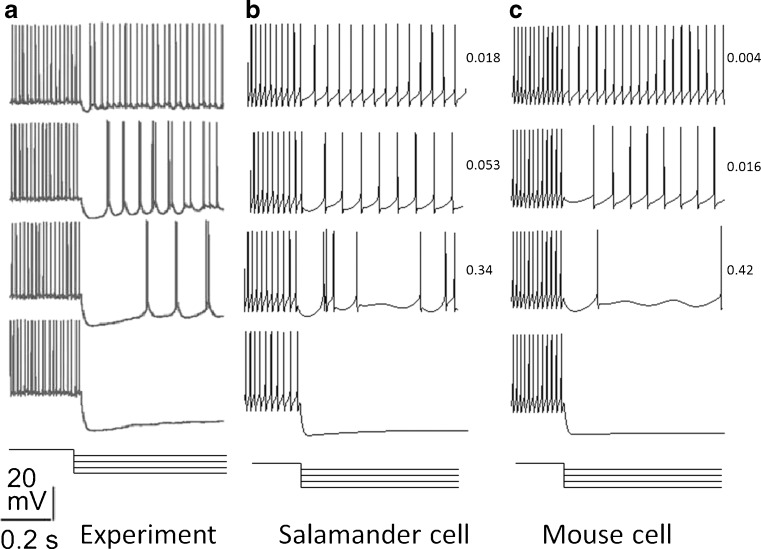
Fig. 11.
Comparison of the experimental results and simulated results for OFF S RGCs to increasing levels of hyperpolarizing current injection. Experimental and simulated responses show transitions from regular spiking to quiescence (V2) and an increase in the CV (V3). Numbers next to simulated responses show the CV. CV was calculated over 10 s of simulated data. The time and voltage scale applies to all plots. Current steps are superimposed and shown below voltage recordings. a Experimental data from Margolis and Detwiler (2007). b Simulation of a salamander cell. In these simulations, ḡ NaP = 3.33 × 10⁻⁶ S/cm2, ḡ T = 5.36 × 10⁻⁴ S/cm2, and ḡ h = 10−5 S/cm2. c Simulation of a mouse cell. In these simulations, ḡ NaP = 2.33 × 10⁻⁵ S/cm2, ḡ T = 2.7 × 10⁻⁴ S/cm2, and ḡ h = 10−11 S/cm2. Current steps for both simulation are: −0.02, −0.04, −0.06, −0.14 nA.

