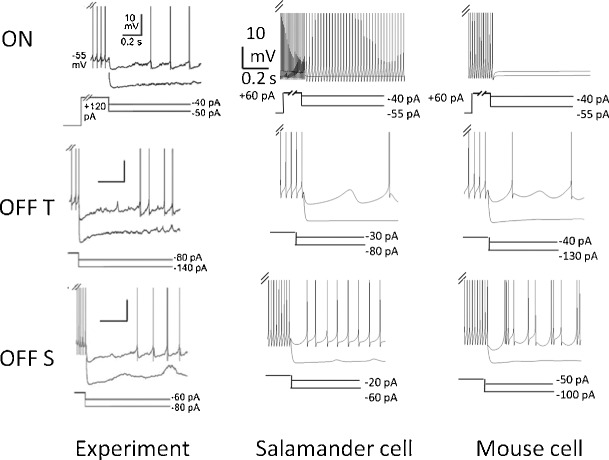
Fig. 13.

Cell transitions in response to an increasing amplitude hyperpolarizing current injection. Shown for comparison are two cells from the salamander and the mouse set, and experimental data (Margolis and Detwiler 2007). Cell responses are superimposed for different levels of current injection. Hyperpolarizing current produced different responses in different cells. Shown below each plot is the hyperpolarizing current levels used in the simulation. The same scale bar applies to all simulated plots. Salamander cell: In OFF S simulations, ḡ NaP = 3.33 × 10⁻⁶ S/cm2, ḡ T = 5.36 × 10⁻⁴ S/cm2 and ḡ h = 10−5 S/cm2. In OFF T simulations, ḡ NaP = 2 × 10⁻⁶ S/cm2, ḡ T = 3.67 × 10⁻⁴ S/cm2 and ḡ h = 10−12 S/cm2. Mouse cell: In OFF S simulations, ḡ NaP = 6.67 × 10⁻⁶ S/cm2, ḡ T = 4.69 × 10⁻⁴ S/cm2 and ḡ h = 10−4 S/cm2. In OFF T simulations, ḡ NaP = 10−15 S/cm2, ḡ T = 4 × 10⁻⁴ S/cm2 and ḡ h = 10−6 S/cm2. In both salamander and mouse ON simulations, ḡ NaP = 10−5 S/cm2, ḡ T = 10−5 S/cm2 and ḡ h = 10−5 S/cm2. Experimental figures adapted from Margolis and Detwiler (2007) with permission
