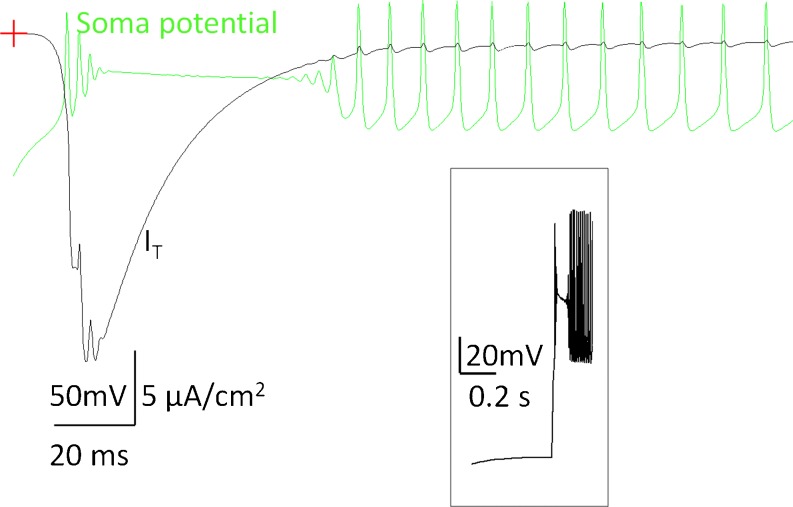
Fig. 14.
Latent period at the termination of a hyperpolarizing current step. Shown is the soma membrane potential (green trace) and I T × 105 (black trace) shown for comparison. Crosshair denotes the zero voltage point. The latent period is related to the inactivation time of I T and can last anywhere between 20 and 80 ms. Insert shows a soma membrane potential on a smaller time scale for better visualization

