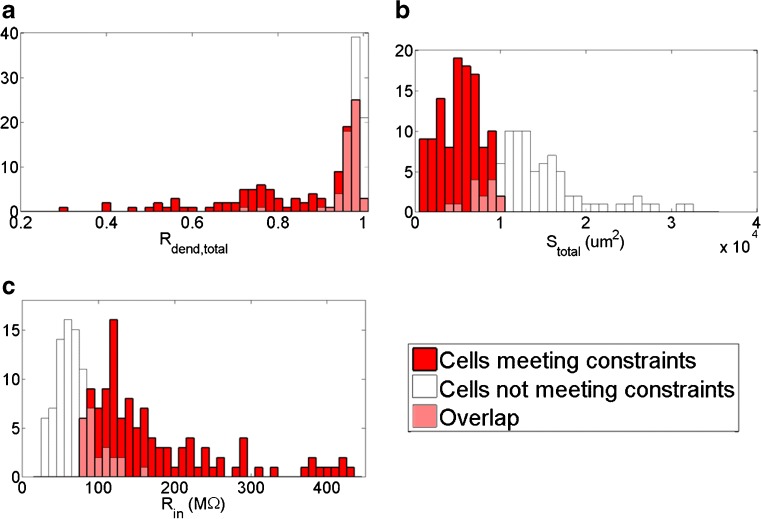
Fig. 3.
Histograms comparing cells that meet model constraints C0-C4 (red) and cells that do not (white). The overlay is shown in pink. a Ratio of dendritic to total surface area, R dend,total. b Total surface area (μm2), S total. c Input resistance into the dendrites from the soma, R in. Means and standard deviations given in Table 6

