Fig. 4.
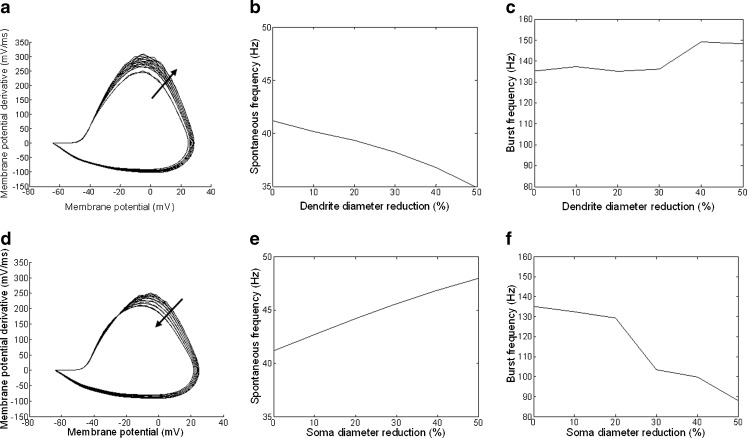
Effect of reducing the dendritic surface area and of reducing the soma’s surface area on a cell’s responses. a–c An OFF S cell was simulated under normal conditions and then with the diameter of each dendritic compartment reduced by 10–50% in steps of 10%. a Phase plot showing that as the surface area is decreased (arrow), the action potentials increase in maximal amplitude and reach a higher rate of change. b The spike frequency shows a decrease in response to the change in morphology. c The burst frequency shows an increasing trend in response to the change in morphology. d–f An OFF S cell was simulated under normal conditions and then with the diameter and length of the soma reduced by 10–50 % in steps of 10 %. d Phase plot showing that as the surface area is decreased (arrow), the action potentials decrease in maximal amplitude and reach a lower maximal rate of change. This results in slower action potentials reaching lower amplitudes. e The spike frequency shows a steady increase in response to the change in morphology. f The burst frequency shows a decreasing trend in response to the change in morphology. In simulations ḡ NaP = 3.33 × 10⁻⁶ S/cm2, ḡ T = 5.36 × 10⁻⁴ S/cm2, and ḡ h = 10−9 S/cm2

