
Fig. 5.
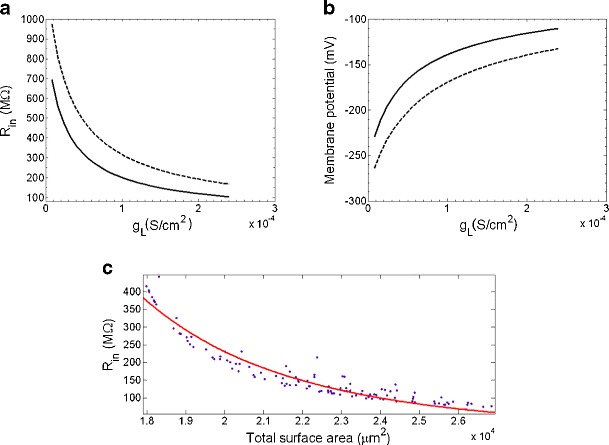
Effect of leak conductance, ḡ L, and total surface area, S total, on the input resistance, and on the membrane potential during a −0.2 nA current step. a Input resistance, R in as a function of ḡ L. b Membrane potential during a −0.2 nA current step as a function of ḡ L. In simulations for a and b, dashed: cell from the Salamander set; Solid: cell from the mouse set. In simulations, ḡ NaP = 1 × 10⁻⁵ S/cm2, ḡ T = 3 × 10⁻⁴ S/cm2 and = 1 × 10⁻⁹ S/cm2. c Input resistance, R in as a function of total surface area, S total. Each individual dot represents a cell. Red: curve fit using a power fit of the form y=ax b, where a = 1.17 × 10²²,b = −4.58. In simulations ḡ NaP = 1 × 10⁻⁵ S/cm2, ḡ T = 3 × 10⁻⁴ S/cm2, ḡ h = 1 × 10⁻⁹ S/cm2, and ḡ L = 1.2 × 10⁻⁴ S/cm2