Fig. 7.

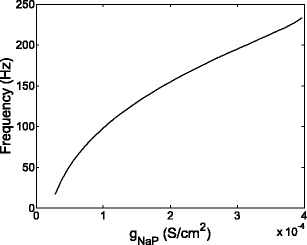
Spiking frequency as a function of ḡ NaP is plotted for a representative cell, showing a monotonically increasing relationship between ḡ NaP and spontaneous frequency. For this simulation ḡ T = 3 × 10⁻⁴ S/cm2 and ḡ h = 1 × 10⁻⁹ S/cm2

Spiking frequency as a function of ḡ NaP is plotted for a representative cell, showing a monotonically increasing relationship between ḡ NaP and spontaneous frequency. For this simulation ḡ T = 3 × 10⁻⁴ S/cm2 and ḡ h = 1 × 10⁻⁹ S/cm2