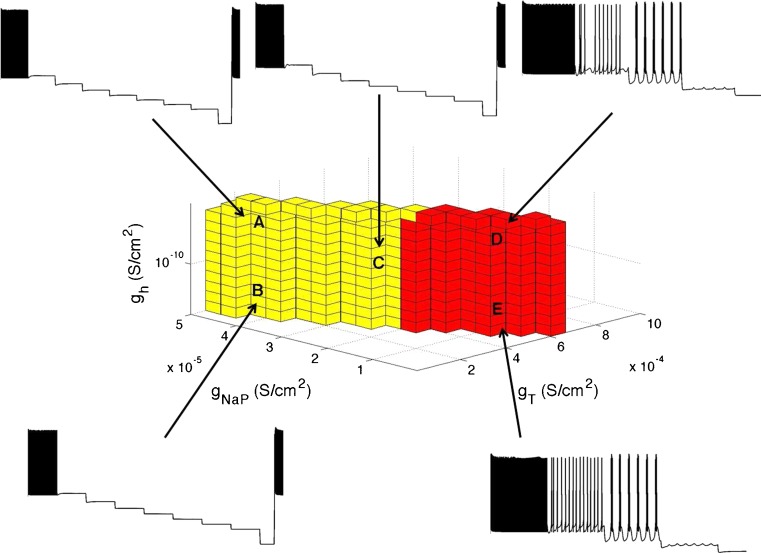
Fig. 9.
The ability of the cells to produce subthreshold oscillations and burst firing for conductance points A, B, C, D, and E is illustrated. Shown are voltage traces for five points from a mouse cell. Voltage traces for all five points are in response to seven increasing hyperpolarizing current steps, each of −0.02 nA and each for 2 s duration. The eighth current step is −0.2 nA and 0.5 s duration. Voltage traces for points D and E are cropped to highlight the cell’s response. For this cell, only conductances in the red region were able to produce sustained oscillations

