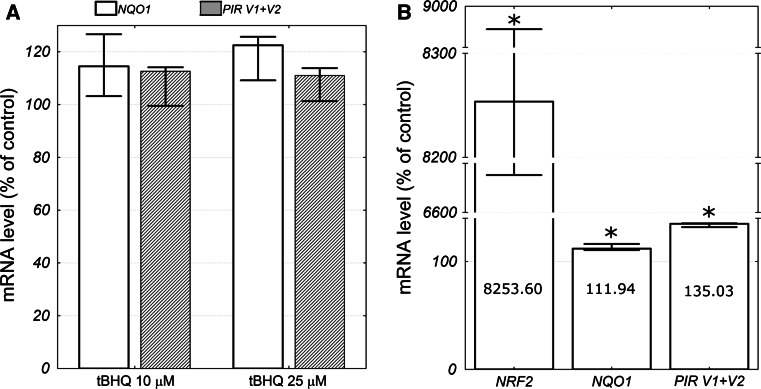
Fig. 4.
a NQO1 and PIR mRNA level in the HeLa cells 5 h after treatment with 10 or 25 μM tBHQ as a percent of the respective mRNA level in the control cells. The columns represent median values, while the bars represent minimum and maximum values from three independent experiments. Differences were not statistically significant in Kruskal–Wallis one way ANOVA. b NRF2, NQO1, and PIR mRNA level in the HeLa cells transfected with pcDNA3-EGFP-C4-Nrf2 plasmid as a percent of the respective mRNA level in the control cells (pEGFP-N2 transfected). The columns represent median values, while the bars represent minimum and maximum values from three independent experiments. The exact median value for each gene is depicted on the respective column. The asterisks denote a statistically significant difference in the Mann–Whitney U test between the mRNA levels in cells transfected with pcDNA3-EGFP-C4-Nrf2 plasmid the control cells

