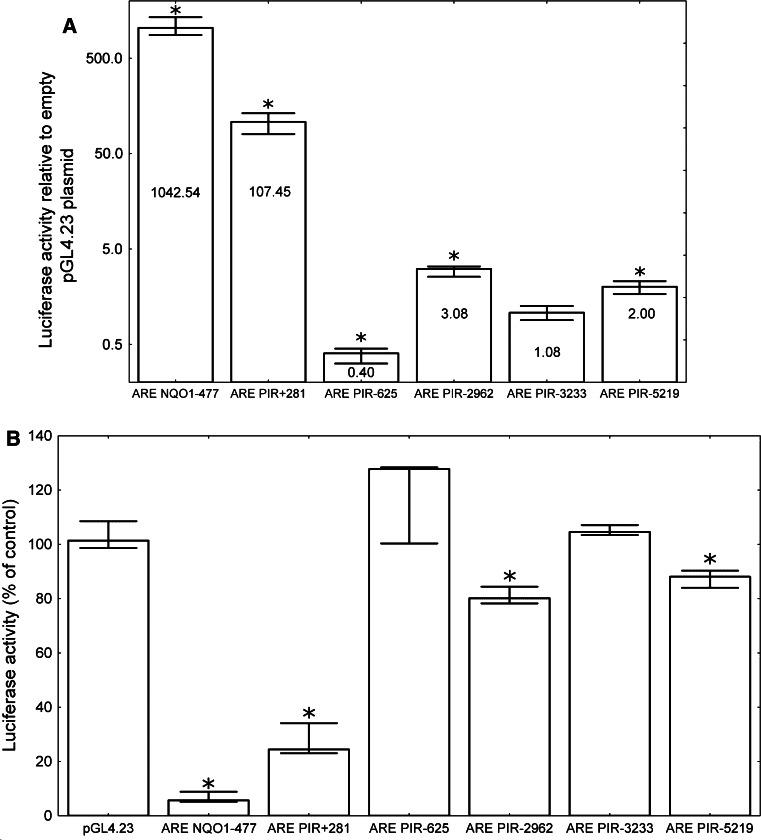
Fig. 5.
The activities of putative AREs from PIR in comparison to the activity of NQO1 ARE. The columns represent median values and the bars represent the minimum and maximum values from four independent experiments. a The HeLa cells were transfected with pGL4.23 plasmids containing various ARE cassettes. The firefly luciferase activity was normalized to the Renilla luciferase activity and is shown as a fold change in the activity relative to the empty vector. An asterisk denotes a statistically significant difference in the Mann–Whitney U test compared to the empty vector. Differences between plasmids are also statistically significant. b The HeLa cells were transfected with pGL4.23 plasmids containing various ARE cassettes together with NRF2-targeted or scrambled siRNA. The firefly luciferase activity was normalized to Renilla luciferase activity and is shown as a percent of the control (scrambled siRNA transfected cells). An asterisk denotes a statistically significant difference in the Mann–Whitney U test between the luciferase activity in the cells transfected with NRF2-targeted siRNA and control cells

