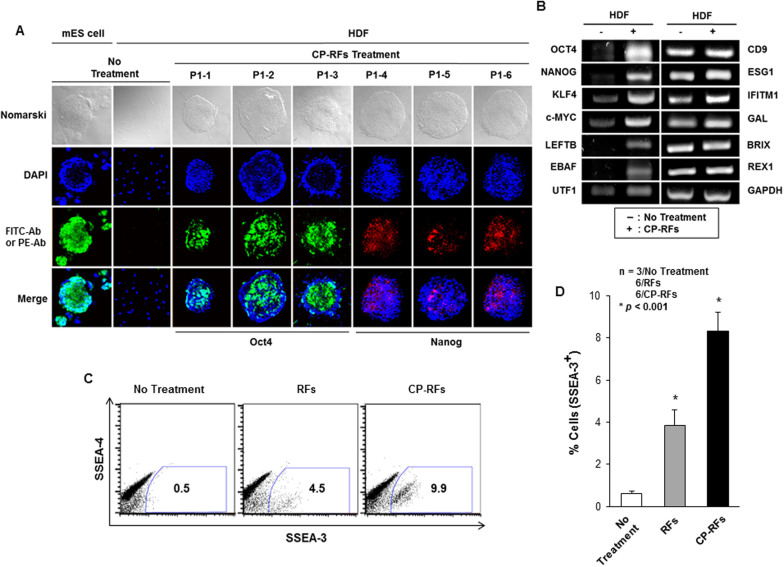
Figure 3. Cell-permeable reprogramming factor-induced colonies express stem cell markers.
(A) OCT4 and NANOG Immunostaining. Murine ES cell colony, MEF feeder layer cells (MEF) and colonies induced by treatment with CP-RFs (Protocol 1: 1 μM each protein, OSKMN, daily for 16 days) were stained. (B) RT-PCR analysis of stem cell biomarker expression. (C–D) Flow cytometric analysis of SSEA-3 and SSEA-4. Cells were stained with fluorescent antibodies against stage specific embryonic antigen 3 (SSEA-3) and 4 (SSEA-4), and measured by FACS analysis (C) and quantified (D). The data are presented as means ± s.d. (n = 3/No Treatment; 6/RFs; 6/CP-RFs). * p < 0.001 as determined by a Student's unpaired t-test.

