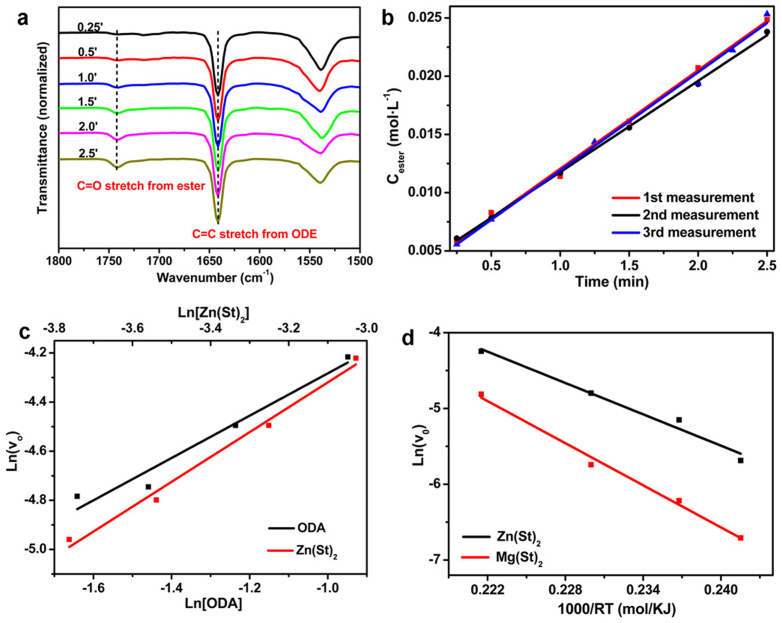
Figure 2. Chemical kinetics of the alcoholysis reactions studied by FTIR.
(a) Temporal evolution of FTIR spectra recorded from an alcoholysis reaction. Reaction conditions: Zn(St)2 0.375 mmol, ODA 3.75 mmol, HSt 0.2 mol, ODE 10.2 g, temperature = 250°C. (b) Determination of the initial reaction rates. The initial formation rates of ester from the three measurements were 8.5 mmol L−1 min−1, 7.9 mmol L−1 min−1 and 8.4 mmol L−1 min−1, respectively. (c) Determination of the reaction orders for Zn(St)2 and ODA from the plot of initial formation rate of ester versus the concentration of Zn(St)2 and the plot of the initial formation rate of ester versus the concentration of ODA, respectively. (d) Irving plots of the initial reaction rates of the alcoholysis reactions. The reactions were carried out at 270, 250, 235 and 225°C respectively.

