Fig. 1.
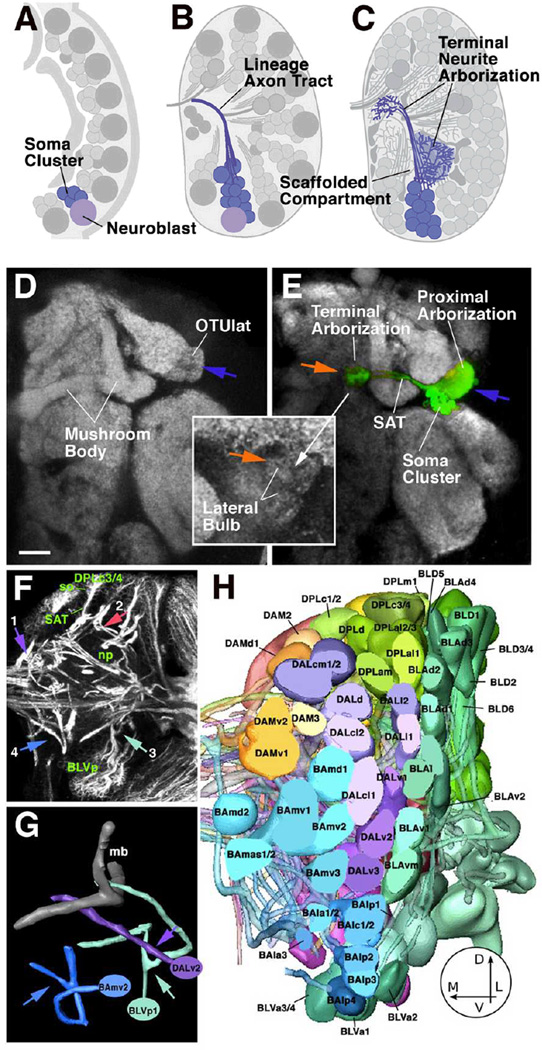
Developmental and structural characteristics of wild-type lineages. A-C: Lineages as units of gene expression, projection, and connectivity. Stereotyped population of neuroblasts generates neurons in the embryo and larva (A). Neurons belonging to one lineage form a cohesive cluster and project their axons in one fascicle (B). Terminal branches of neurons of one lineage arborize in specific neuropile compartments (C). D, E: Z-projection of adult brain hemisphere labeled with anti-Bruchpilot (Nc82; Kittel et al., 2006) to visualize neuropile compartments (white). In E, one lineage, DALcl1, is labeled by expression of GFP. Note dense proximal arborization restricted to lateral domain of optic tubercle (OTUlat; one of the optic foci); distal arborization is restricted to the lateral bulb, one of the input regions of the central complex. F: Z-projection of 10 successive 1µm confocal cross sections at level of central neuropile. Secondary lineages, their axon tracts (secondary axon tracts; SATs) and neuropile fascicles formed by convergence of SATs are labeled with anti-Neurotactin antibody (white). Clusters of somata (so) belonging to lineages are located in the cortex; axon tracts project centripetally into the neuropile (np). Arrows point at lineages representing the types of SAT trajectories observed: SAT is unbranched and enters the neuropile in a straight course (1; DPMm lineage) or after a sharp turn at the cortex-neuropile boundary (2; DPLc3/4). (3) SAT bifurcates into two branches at cortex-neuropile boundary (BLVp1/2); (4) distal part of SAT bifurcates in neuropile (BAmv2). G: Digital models of three representative lineage tracts illustrating typical branching behavior of SATs [DALv2: straight unbranched entry into neuropile; BLVp1: bifurcation at point of entry into neuropile (arrowhead); BAmv2: bifurcation in distal leg of SAT]. H: 3D digital models of all clusters of neuronal somata representing all lineages of one brain hemisphere; anterior view. The polar region of the cortex was removed for clearer view of lineages. (panels F-H modified from from Fung et al., 2009).
Bar: 20µm

