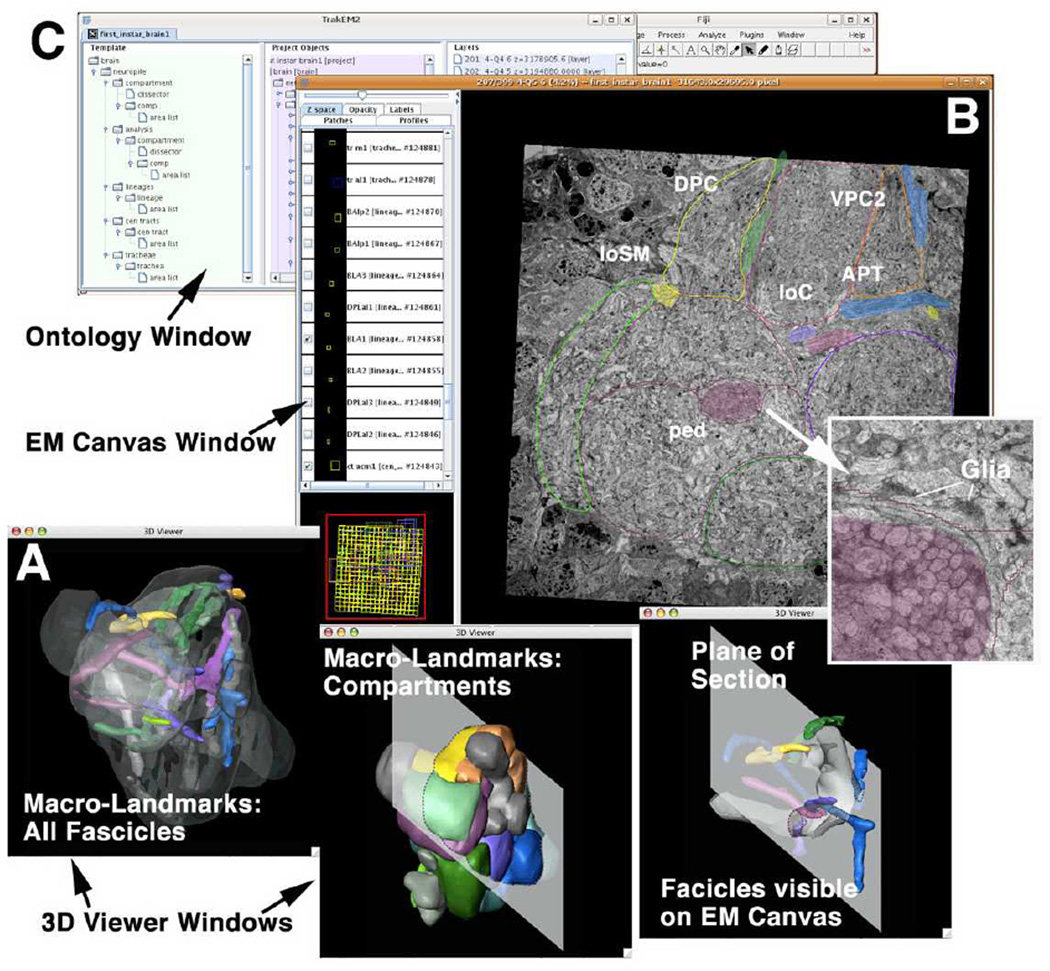
Fig. 3.
The graphical user interface of TrakEM2. The EM canvas presents the EM stack. The user can scroll and navigate through all sections in the “Google Map” style. Identified structures (e.g., compartments and lineage tracts) can be segmented. The ontology window displays all segmented objects as a hierarchically organized list. The interactive 3D viewer windows show selected objects segmented from the EM stack.

