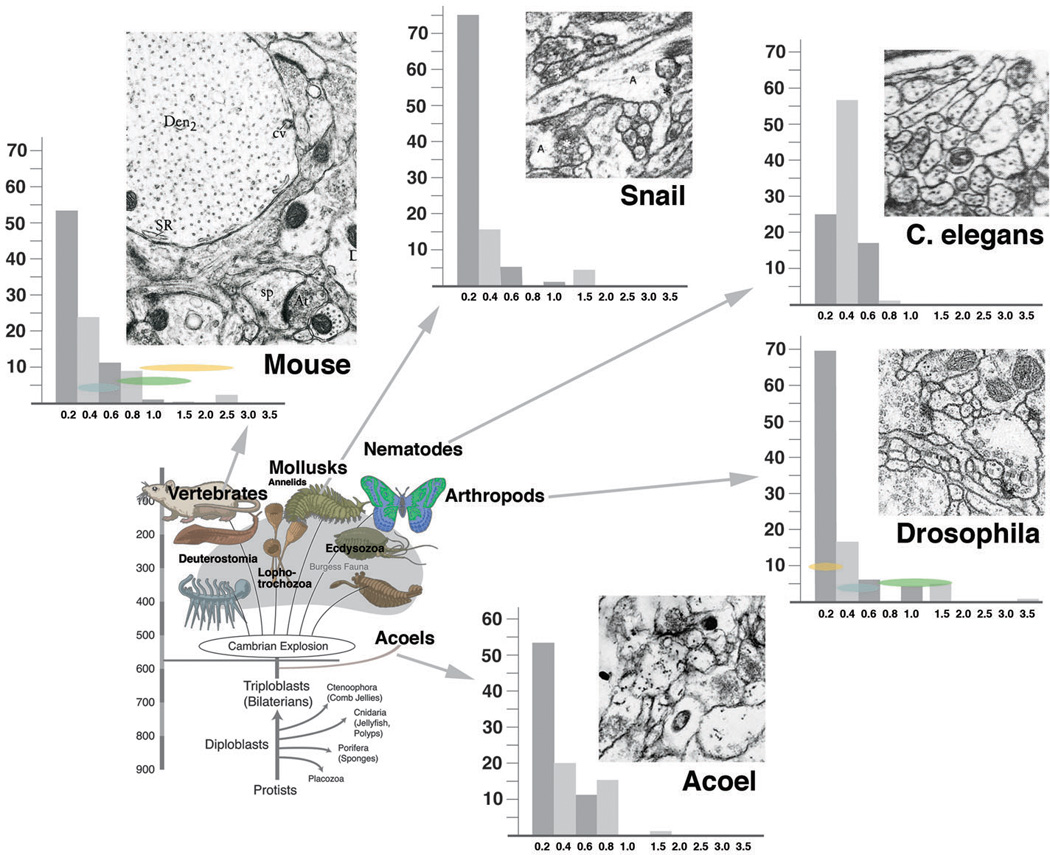
Fig. 8.

Frequency distribution of neurites with different diameters across multiple phyla. Bottom left: highly schematic phylogenetic diagram depicting basal metazoa and major groups of bilaterians. Top and left: representative EM sections of neuropile of five phyla [chordata: mouse (from Peters et al., 1976); mollusca: pond snail (Nagy and Elekes, 2000); nematoda: C. elegans (White et al., 1986); arthropoda: Drosophila (our material); acoela: Neochildia (our material); all shown at same scale]. Next to EM sections are histograms depicting size distribution of neurite profiles. In all phyla except nematoda, thin profiles (< 0.2µm) represent majority of neurites, followed by intermediate profiles (0.4–0.6µm) and large profiles (> 0.6µm). For details, see text.
