Figure 3.
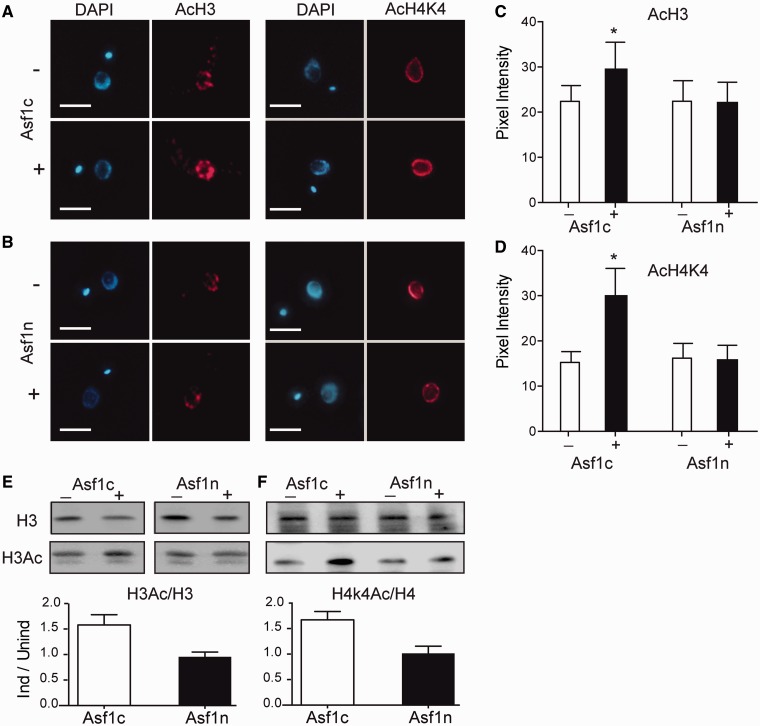
Cytosolic but not nuclear Asf1 overexpressors show increased levels of acetylated forms of histone H3 and H4. Control (–) or parasites overexpressing (+) Asf1c (panel A) or Asf1n (Panel B) were stained with specific antibodies against acetylated histone H3 (right) or acetylated histone H4 (left), both in red. DNA is stained with DAPI. Bars = 3 µm. Panels (C) and (D) show the quantification of the fluorescence intensity (means ± standard deviations) for AcH3 and AcH4K4, respectively, in Asf1-overexpressing cells (n = 35 each). The asterisk indicates significant differences as determined by Student’s t-test (P < 0.05). (C) The same parasites were used for western blot analysis using antibodies specific for histone H3 and H3Ac (E) or histone H4 and H4K4Ac (F). The ratio between acetylated and total histones is shown below the panels. Similar amounts of protein were separated in the gel as assessed by Ponceau S labeling. Similar ratios were obtained in two additional experiments, for each histone.

