Figure 4.
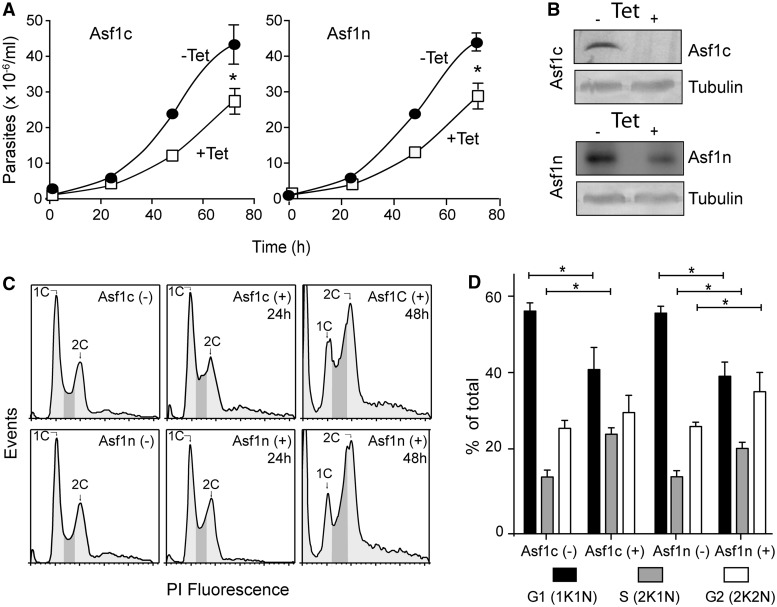
Knockdown of each Asf1 arrests the cells at different positions in S phase. (A) Growth curve of parasites after induction (+Tet, open squares) or no induction (−Tet, closed circles) of RNAi targeting Asf1c (left panel) or Asf1n (right panel). The values are means ± standard deviations (n = 4). Asterisks indicate statistically significant differences (P < 0.05). (B) Western blot analysis of whole parasite cell extracts obtained from non-induced (−) or Tet-induced for 48 h (+) incubated with anti-Asf1c and anti-Asf1n antibodies. Tubulin served as a loading control. (C) Representative flow cytometer histograms of 10 000 events of both knockdown cell lines incubated without (−) or with Tet for 24 and 48 h (+). The peaks correspond to single and double genomic DNA content (C1 and C2, respectively), and the dark gray area corresponds to cells in S phase (D) Graphic showing the percentage of cells in different stages of the cell cycle after 48 h of treatment with (+) or without (−) Tet for induction of RNAi (G1 populations with 1 kinetoplast and 1 nucleus (1K1N) are shown in black, S (2K1N) in gray, and G2 (2K2N) in white bars) scored by microscopic examination of cells stained with DAPI. Bars with asterisks indicate statistically significant differences using Student’s t-test P < 0.055 after counting at least 40 cells in each situation.

