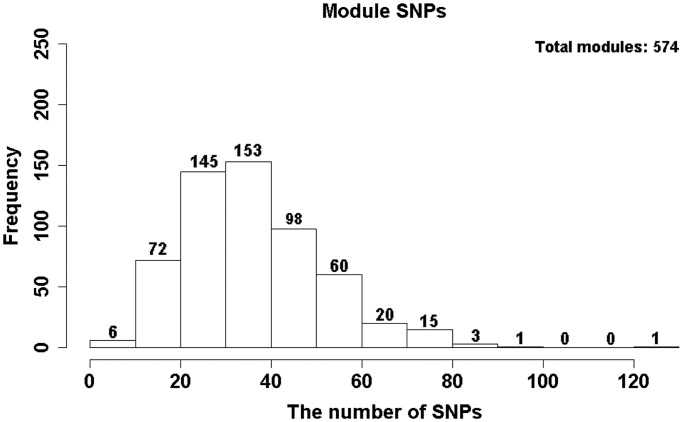
Figure 2.
The distribution of the number of causal SNPs underlying the discriminative modules. Module-level eQTL mapping was performed with the SPLS method. A module of transcripts is considered as a multivariate response and is jointly analyzed by using multiple SNPs typed within 1 Mb of the transcriptional start or stop site of all module members.

