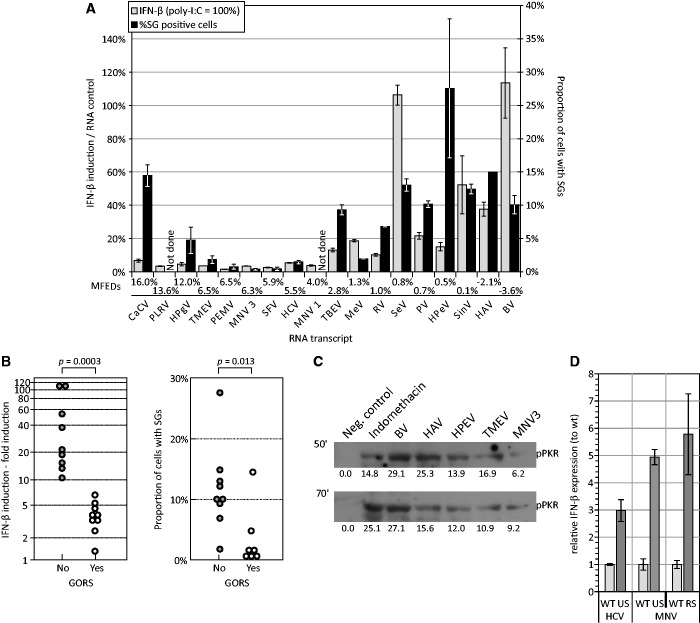
Figure 5.
Relationship between IFN-β/ SG induction and RNA structure. (A) Induction of IFN-β (as a proportion of that induced by poly-I:C) and SG (frequencies of G3BP-positive cells) for transcripts from different viral genomes ranked from high to low by MFED value (x-axis). GORS threshold is considered to be 3% MFED. Bar heights represent the mean of at least two biological replicates; error bars show standard deviations. (B) Segregation of IFN-β and SG induction values by possession of GORS using 3% MFED threshold. P-values above graph show significance values calculated by Kruskall–Wallace non-parametric test. (C) Detection of phosphorylated PKR by western blot in cell lysates collected 50 min post-transfection of unstructured (BV, HAV and HPeV) and structured (TMEV, MNV3) transcripts. Numbers below bars indicate densitometry quantitation of target band (D) IFN-β response relative to that of wild type HCV and MNV transcripts with permuted sequences and of identical composition, coding and codon structure (US, RS). RNA secondary structure was disrupted in US transcripts with MFEDs of approximately zero; the RS transcript contained a (re-stabilized) synthetic RNA secondary structure with an MFED equal to that of WT virus Bar heights represent the mean of two biological replicates; error bars show SDs.

