
Table 2.
RNA-folding energies and composition of RNA transcripts
| Transcript | MFEa | MFED (%)b | GORSc | G + C | CpGd | UpAe |
|---|---|---|---|---|---|---|
| CaCV | −77.0 | 16.0 | Yes | 0.468 | 0.766 | 0.505 |
| PLRV | −84.2 | 13.6 | Yes | 0.508 | 0.809 | 0.652 |
| HPgV | −115.1 | 12.0 | Yes | 0.594 | 0.692 | 0.575 |
| TMEV | −73.7 | 6.5 | Yes | 0.502 | 0.586 | 0.590 |
| PEMV | −93.7 | 6.5 | Yes | 0.559 | 0.735 | 0.758 |
| MNV3 | −99.1 | 6.3 | Yes | 0.579 | 0.605 | 0.455 |
| SFV | −84.4 | 5.9 | Yes | 0.526 | 0.853 | 0.816 |
| HCV | −101.9 | 5.5 | Yes | 0.588 | 0.686 | 0.802 |
| MNV1 | −96.2 | 4.0 | Yes | 0.572 | 0.605 | 0.500 |
| TBE | −93.8 | 2.8 | No | 0.549 | 0.527 | 0.369 |
| MeV | −70.2 | 1.3 | No | 0.534 | 0.581 | 0.601 |
| RV | −118.2 | 1.0 | No | 0.716 | 1.130 | 0.678 |
| SeV | −72.0 | 0.8 | No | 0.47 | 0.517 | 0.789 |
| PV | −70.3 | 0.7 | No | 0.475 | 0.568 | 0.855 |
| HPeV | −62.2 | 0.5 | No | 0.392 | 0.225 | 0.678 |
| SiV | −71.6 | 0.1 | No | 0.513 | 0.863 | 0.782 |
| HAV | −61.7 | −2.1 | No | 0.366 | 0.069 | 0.564 |
| BV | −51.2 | −3.6 | No | 0.335 | 0.258 | 0.802 |
aMinimum folding energy (Kcal/mol).
bMFE difference from sequence order randomized control.
cThreshold of 3% MFED value.
dObserved to expected value: 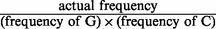 .
.
eObserved to expected value: 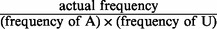 .
.