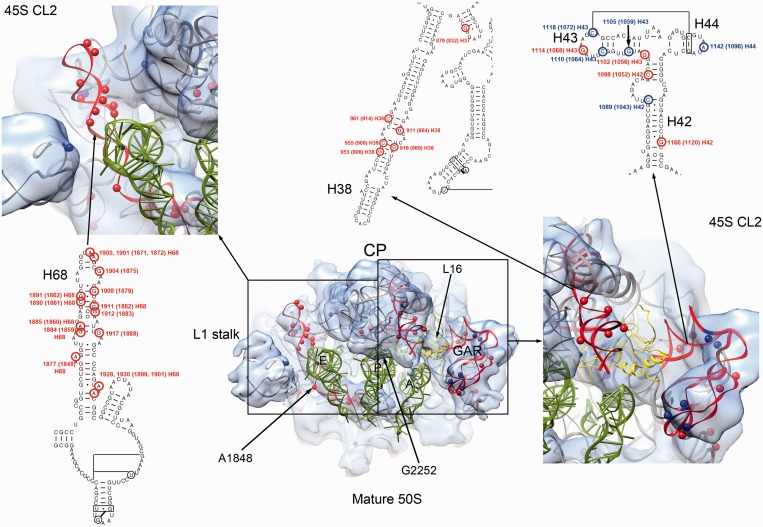
Figure 6.
Bases with increased and decreased chemical reactivity in the 45S particle. The center of the figure shows a top view of the 50S subunit cryo-EM map. The X-ray structure of the 50S subunit from E. coli (PDB ID 2AW4) is shown docked into the cryo-EM maps. The r-proteins from the X-ray structure have been removed for clarity, except L16 that is displayed as a yellow ribbon. Helices 68, 38 and GAR (helices 42–44) that showed the highest levels of chemical modification are colored in red. Bases with increased and decreased reactivity to DMS and kethoxal in these helices are displayed in the 3D structure as red and blue spheres, respectively. They are also mapped into the secondary structure of the 23S rRNA. Detailed views of the framed areas are shown at both sides. In these views the cryo-EM map displayed is that from the 45S particle conformation subpopulation ‘CL2’ for easier comparison between the chemical modification data and the structural distortions observed in the immature ribosomal subunit. Landmarks of the 50S structure including the CP, and L1 stalk are indicated. A, P and E tRNA molecules are also shown for orientation purposes.

