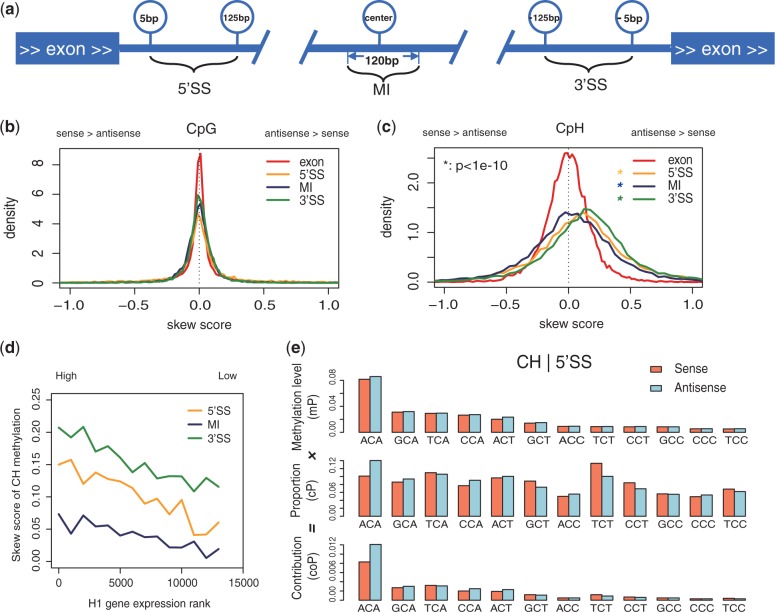
Figure 2.
Strand-specific non-CpG methylation in human gene body. (a) Diagram of the four regions analyzed in this study. Three intronic subregions are examined: 5′SS (5∼125 bp downstream of donor site), MI (120-bp region in the center of the intron) and 3′SS (125∼5 bp upstream of acceptor site). (b) Density plots of the skew scores for CpG methylation in different regions. x-axis, skew score. For skew score, 0 indicates no skewness, positive value indicates higher mCpH in antisense strand and negative value indicates the opposite. All the three subregions in intron showed significant skew of non-CpG methylation. P-value, one-tailed t-test. (c) Density plots of the skew score for CpH methylation in different regions. Similar with (b), (d) the skew score of non-CpG methylation in introns are positively correlated with the transcription levels (H1). X-axis, rank of transcription levels from high (left) to low (right). Y-axis shows the skew score. The skew score of each site is the average of 1000 transcripts. (e) Asymmetric sequences in intron guide skewed non-CpG methylation (H1). Context study showed asymmetric sequence guided the skew of non-CpG methylation. Analysis is carried on 3-mer patterns (NCH) in 3′SS of H1. The average methylation levels (mP, upper) of each pattern showed similar methylation levels on both strands. Patterns are ordered by average methylation level. The proportions of these 3-mers in sequence composition (cP, middle) showed asymmetric distribution of sequence. The contributions to methylation levels in the whole (coP = mP × cP, lower) of each 3-mer pattern are shown in bars. The enrichment of non-CpG methylation motifs on the antisense strand makes the higher methylation levels of non-CpG.

