Figure 3.
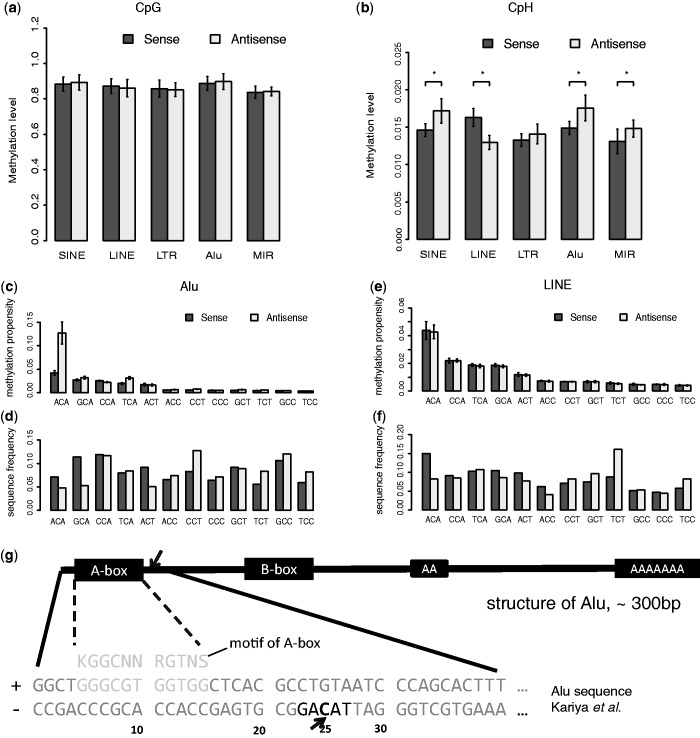
Characterize the strand-specific non-CpG methylation in transposons. (a) The strand-specific methylation levels of CpG sites in different transposon groups in ADS-iPSC. Alu elements and MIR elements are two subgroups of SINE elements. Heights of bars and error bars are the means and standard deviations of the average methylation levels in each chromosome. All groups show concordant CpG methylation levels on two strands; (b) the strand-specific methylation levels of CpH sites in different transposon groups in ADS-iPSC. Asterisk indicates P < 0.01. P-value, two-tailed t-test, (c) the methylation propensity (average methylation level) of each 3-mer on two strands of Alu. Error bar, standard deviation of the average methylation levels in each chromosome, (d) the sequence frequencies of each 3-mer on the two strands of Alu elements, (e) the methylation propensity (average methylation level) of each 3-mer on two strands of LINEs, (f) the sequence frequencies of each 3-mer on the two strands of LINEs, (g) the 25 bp position from 5′ end of Alu (antisense strand) shows high non-CpG methylation levels. From the structure of Alu, the high methylated non-CpG position is right after A-box, which is known as binding site of Pol-III together with B-box. The highly methylated non-CpG site is in TACAG context.

