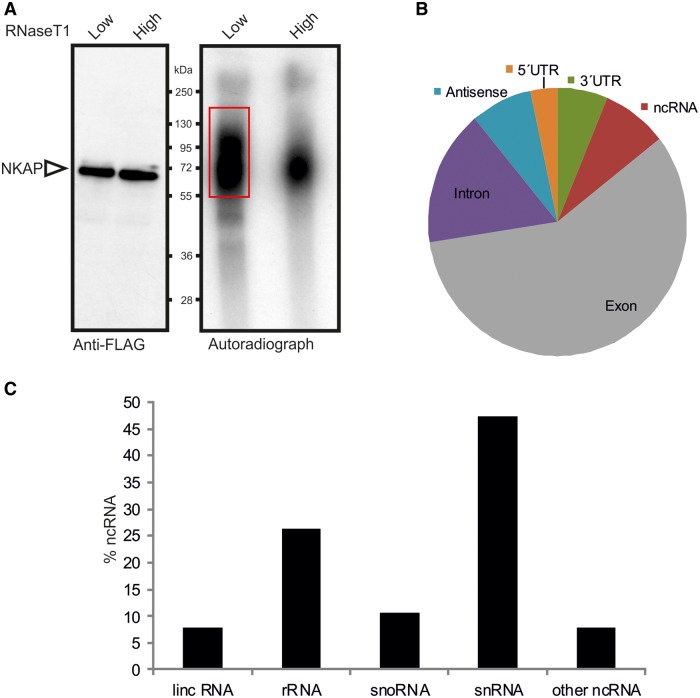
Figure 8.
Global analysis of NKAP binding to RNA by CLIP-seq. (A) Autoradiograph of cross-linked NKAP-RNA complexes using denaturing gel electrophoresis and membrane transfer. RNA was partially digested using low or high concentration of RNase T1. The marked area was cut from the membrane and subjected to protocols for the isolation of RNA, which was further used for RNA-seq. (B) Distributions of NKAP CLIP-tags. Binding regions are mapped to exons, UTRs, introns, antisense and ncRNAs according to the University of California, Santa Cruz human genome browser. Pie-charts show ratios of binding regions mapped to the indicated regions. (C) Distribution of cross-link sites within the ncRNA classes.

