Figure 3.
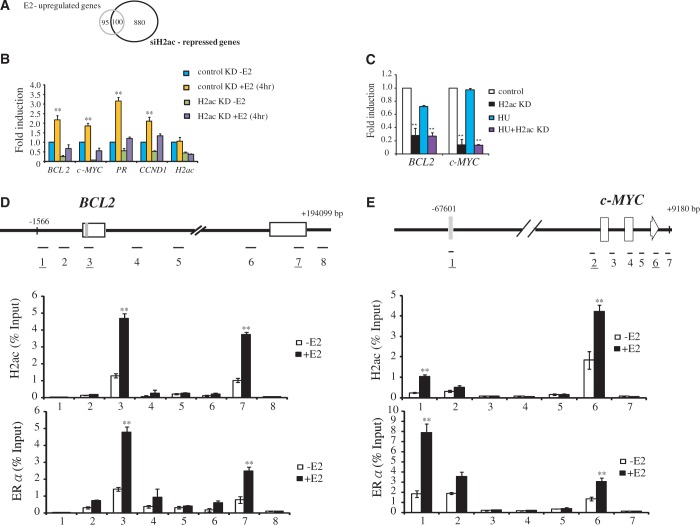
H2ac regulates E2-dependent gene transcription in MCF-7 cells. (A) A Venn diagram showing the number of E2 upregulated genes affected by knockdown of H2ac in MCF-7 cells. (B) Expression levels of BCL2, c-MYC, CCND1, PR and H2ac in MCF-7 cells depleted of H2ac using specific siRNA in the absence (−E2) or presence (+E2) of estradiol for 4 h. mRNA expression levels were determined by quantitative RT-PCR and normalized against 18s rRNA (**P < 0.01, t-test). (C) Expression levels of BCL2 and c-MYC in HU-treated and H2ac-depleted MCF-7 cells. mRNA expression levels were determined by quantitative RT-PCR and normalized against 18s rRNA (**P < 0.01, t-test). (D-E) Upper panel: Schematic diagram of BCL2 and c-MYC genes showing enhancers (gray bars), exons (open boxes) and primer sets (eight segments in the BCL2 gene and seven segments in the c-MYC gene) used to produce the ChIP amplicons. The numbers of primer pairs covering enhancer, promoter and 3′UTR regions were underlined. Lower panel: Distribution of H2ac and ERα, respectively, in the BCL2 and c-MYC gene. The specific antibodies used in the ChIP experiments were anti-H2ac and anti-ERα. DNA isolated from immunoprecipitated chromatin was subjected to qPCR to amplify the DNA fragments. Data represents mean ± SD for at least two independent experiments (** P < 0.01, t-test).

