
Figure 4.
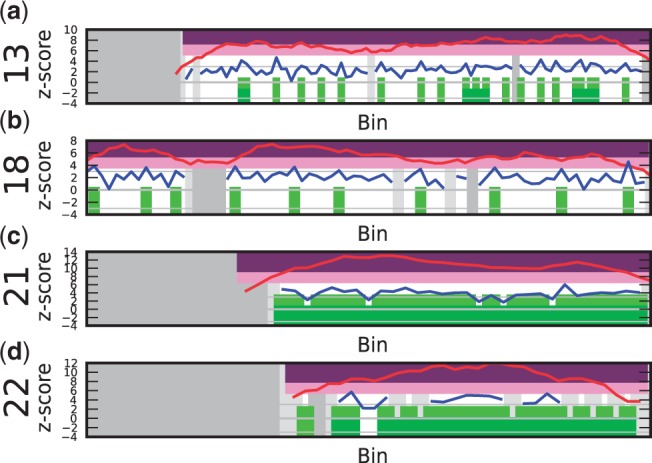
Samples with trisomies 13, 18, 21 and 22 demonstrate the difference in calling results from the sliding window method and the individual bin method. The vertical axis depicts the z-score, and the horizontal axis the bins on chromosomal positions. The blue line shows the z-score per bin, the red line plots the z-score using the sliding window ( ). Purple regions show bins called by WISECONDOR (i.e. the sliding window approach). Dark green regions mark bins called with the individual bin method. Light green and pink regions are bins found deviating, by the individual bin and sliding window approach respectively, but those are too small in width such as spikes (and thus did not pass WISECONDOR’s minimum size requirement). Horizontal gray lines denote the abs(z) = 3 threshold. Gray regions are uncallable regions, where light gray is caused by being unable to find enough reference bins and dark gray regions are bins containing mostly unmappable (repetitive) sequences. (a) Sample A5: Trisomy 13. (b) Sample A9: Trisomy 18. (c) Sample A11: Trisomy 21. (d) Sample C18: Trisomy 22.