
Figure 5.
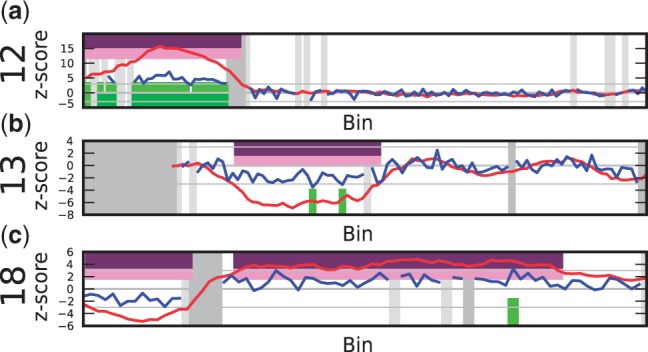
Output results for subchromosomal aberration detection (for an explanation of the plots, see Figure 4). (a) Sample C13: isochromosome 12p10. (b) Sample C5: deletion in the middle of the long arm of chromosome 13. (c) Sample C6: loss of the short arm on chromosome 18 (18p10) to the left and the gain of the long arm (18q10) to the right of the centromere. Note the difference in signal height between the two extra copies on chromosome 12p, and one extra copy on chromsome 18q.