
Figure 7.
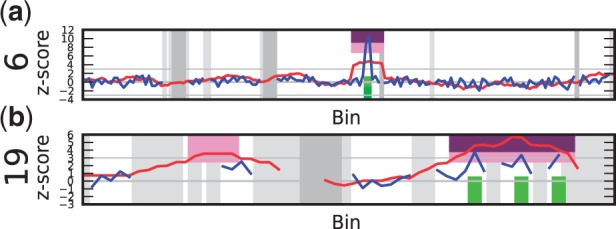
Examples of false positives (for an explanation of the plot see Figure 4). (a) Sample D11: false positive on chromosome 6. A 2 Mb sized peak is spread out due to the sliding window method. Additional testing proved this was caused by a maternal CNV. (b) Sample C21: false positive on chromosome 19. Note the lack of data points (testable bins) as can be seen from the shape of the blue line and the large amount of gray areas, which is most likely caused by the different GC-content in chromosome 19 compared with other chromosomes.