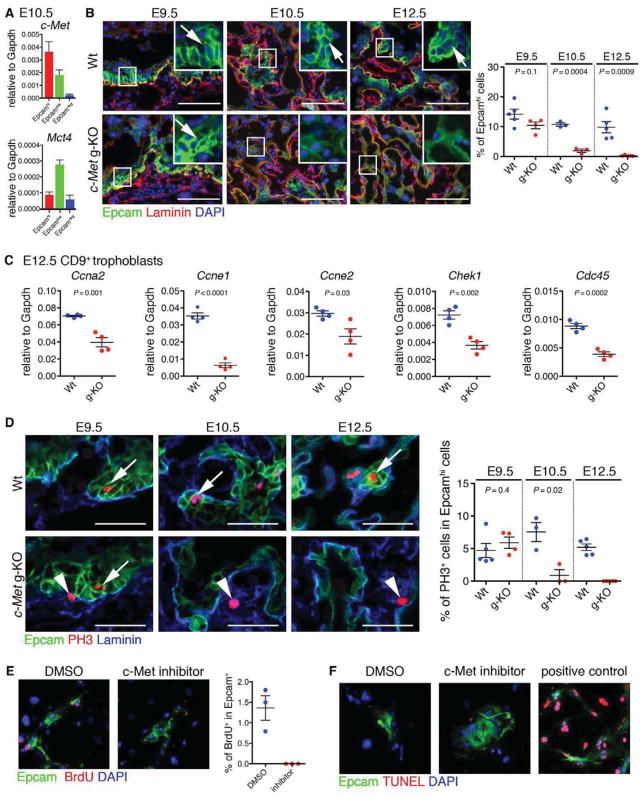
Figure 4. c-Met signaling regulates the maintenance of LaTP.
(A) QRT-PCR documenting the expression of c-Met in both Epcamhi LaTP and Epcamlow SynT.
(B) IF for Epcam (green) and Laminin (red) on Wt and c-Met g-KO placenta at E9.5, 10.5 and 12.5 documenting loss of Epcamhi cells in c-Met deficient placenta after E9.5. Arrows, Epcamhi cells adjacent to Laminin+ mesenchymal cells. Scale bar 100 μm.
(C) QRT-PCR analysis of gene expression in CD9+ trophoblast from Wt and c-Met g-KO placentas verifying down-regulation of cell cycle regulators.
(D) IF for Epcam (green), phospho Histone-H3 (PH3, red) and Laminin (blue) on Wt and c-Met g-KO placenta at E9.5, 10.5 and 12.5 documenting premature loss of proliferative LaTP in c-Met deficient placenta. Arrows, PH3+ Epcamhi cells. Arrowheads, PH3+ Epcam− cells. Scale bar 50 μm.
(E) Treatment of cultured LaTP with c-Met inhibitor documents reduced BrdU incorporation in Epcam+ cells. Epcam (green), BrdU (red) DAPI (blue).
(F) Treatment of cultured LaTP with c-Met inhibitor documenting no difference in cell death of Epcam+ cells. Epcam (green), TUNEL (red) DAPI (blue). Positive control, cells treated with DNase I.
All error bars indicate SEM (Standard error of mean).
See also Figure S4.

