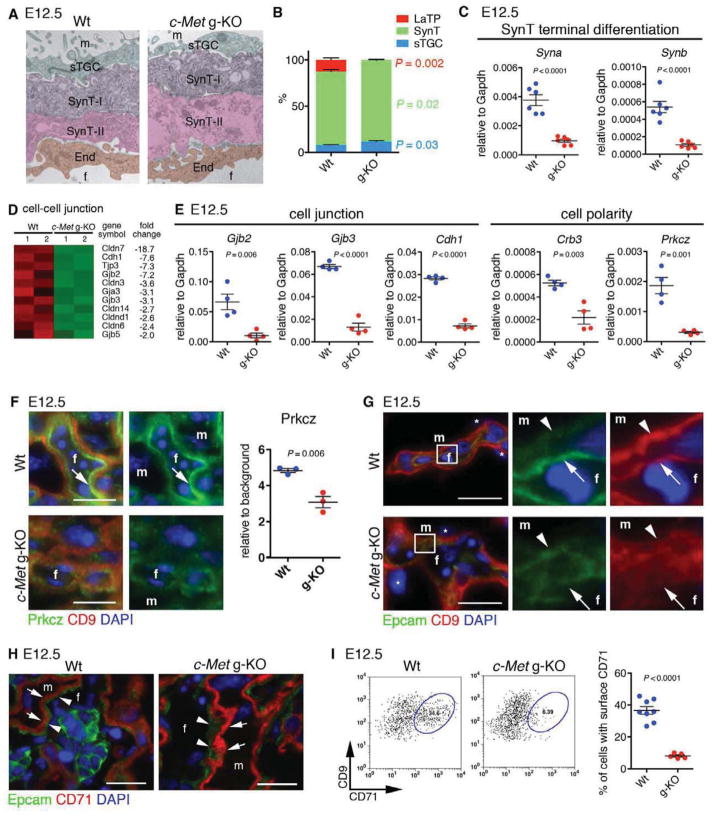
Figure 5. c-Met signaling is dispensable for SynT and sTGC specification but essential for SynT terminal differentiation and cell polarity.
(A) Electron microscopy showing tri-laminar structure of labyrinth trophoblasts (SynT-I, -II and sTGC) in Wt and c-Met g-KO placentas.
(B) Quantitative analysis for trophoblast subtypes.
(C) QRT-PCR showing decreased expression of Syna and Synb in E12.5 c-Met KO CD9+ trophoblasts.
(D) Heatmap of cell-cell junction genes differentially expressed between Wt and c-Met g-KO CD9+ trophoblasts.
(E) QRT-PCR showing reduced expression of cell-cell junction and cell polarity genes in c-Met g-KO trophoblasts.
(F) IF for Prkcz (green) and CD9 (red) showing polarized localization of Prkcz protein in fetal side of SynT-II in Wt placenta (arrow), and diffuse and decreased expression of Prkcz in c-Met g-KO placenta. DAPI (blue, nuclei)
(G) IF for Epcam (green), CD9 (red), and DAPI (blue) on Wt and c-Met g-KO placenta at E12.5. Arrows indicate fetal side of SynT-II and arrowheads indicate apical membrane of SynT-I. m, maternal blood space; f, fetal vascular lumen.
(H) IF for Epcam (green), CD71 (red), and DAPI (blue) on placental section at E12.5. Expression of cytoplasmic CD71 in SynT-I (arrowheads) is observed in both Wt and c-Met g-KO placenta.
(I) FACS analysis indicating reduced surface expression of CD71 on SynT in c-Met g-KO placentas.
All error bars indicate SEM (Standard error of mean).
See also Figure S5.

