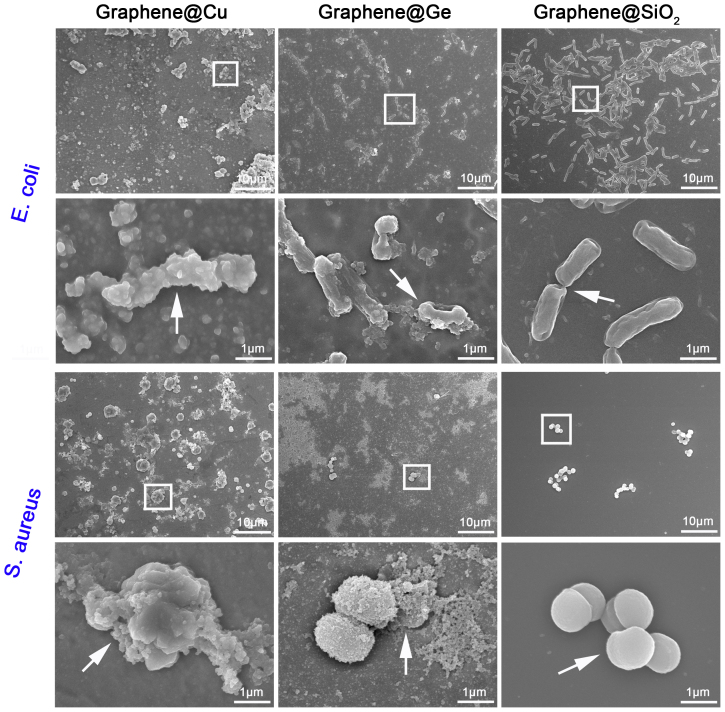
Figure 5.
SEM morphology of the E. coli cells (top panel) and the S. aureus cells (bottom panel) that were seeded onto the graphene films at both low and high magnification, with the seeded concentration of bacteria being 107 CFU/mL. The white arrows at high magnification correspond to the rectangular areas at low magnification, respectively.

