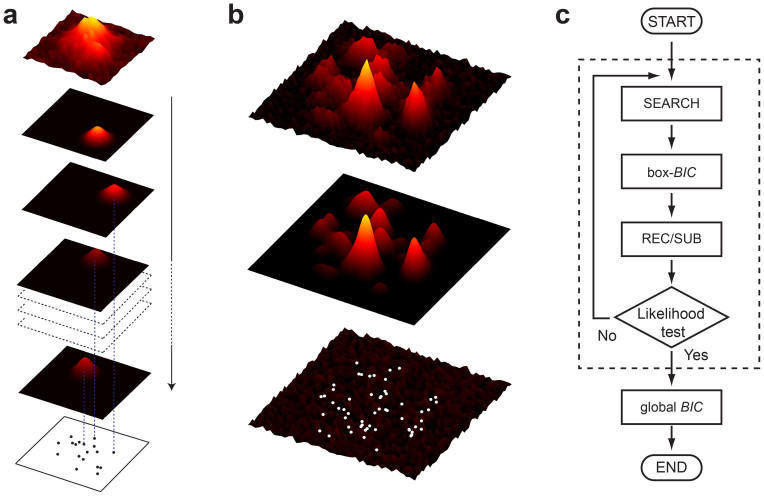
Figure 1. Schematic principle of the algorithm.
(a) The nanoscopy image is progressively decomposed into PSFs via BIC analysis, providing the reconstructed image and the molecular localizations of single markers. (b) Representative simulated image showing intensity peaks over a background noise (top) and the reconstructed profile (middle). The bottom panel shows the residual noise and the positions of the localized particles (dots). (c) Flow diagram of the algorithm.

