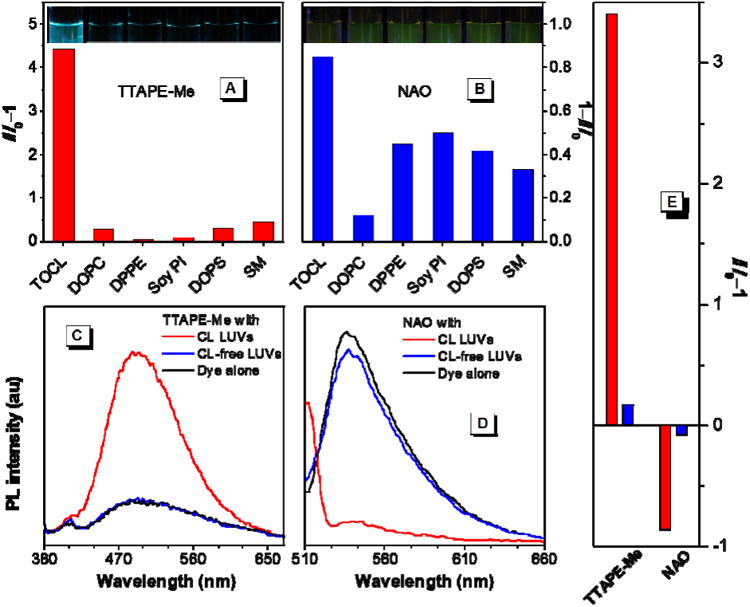
Figure 4.

(A,B) Change in fluorescence intensity of (A) TTAPE-Me and (B) NAO with vesicles of different lipid contents (left to right: 20% TOCL, 100% DOPC, 40% DPPE, 2% soy PI, 1% DOPS, and 2% SM; the rest of each type of vesicles is filled by DOPC). Insets: Corresponding fluorescence photographs of TTAPE-Me and NAO solutions in the presence of these LUVs. (C,D) Emission spectra of (C) TTAPE-Me and (D) NAO with CL-containing and CL-free all-component vesicles. (E) Bar chart of the change in fluorescence intensity shown in panels C and D (red: CL-containing vesicles, blue: CL-free vesicles). [dye] = 10 μM; [lipid]total = 22 μM; for TTAPE-Me, λex = 350 nm, λem = 480 nm; for NAO, λex = 499 nm, λem = 530 nm.
