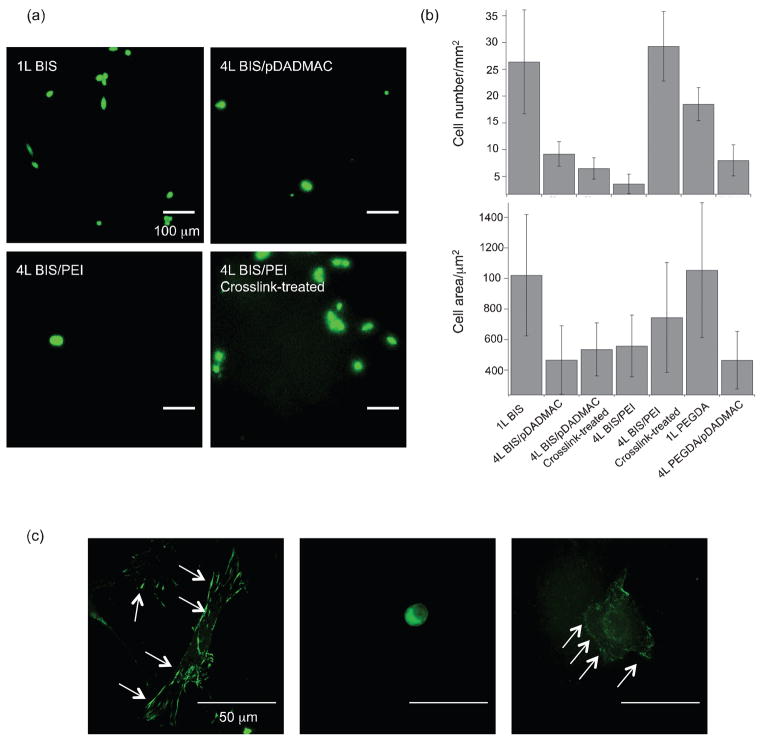
Figure 7.
Fibroblast adhesion on microgel films after 24h culture at 37°C. (a) Representative images of LIVE/DEAD staining of cells on various films; scale bar = 100 μm (b) (upper panel) The number of cells adhered on the films analyzed from LIVE/DEAD images; 4L BIS/pDADMAC vs. 4L crosslink-treated BIS/pDADMAC, p=0.206; all others p<0.04(lower panel) Area of adhered cells analyzed from LIVE/DEAD images; all p>0.1 (c) Vinculin expression of fibroblasts cultured on various films; 1L BIS (left), 4L untreated BIS/PEI (middle), and 4L crosslink-treated BIS/PEI (right). Arrows in images indicate vinculin staining; scale bar = 50 μm.

