
Figure 5.
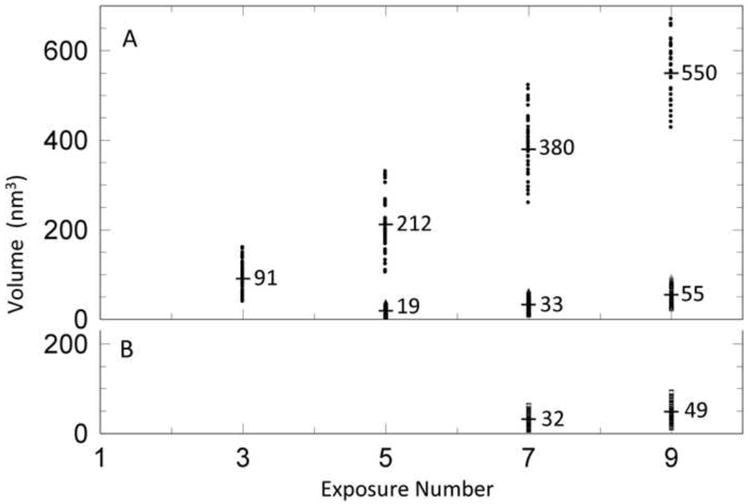
Increase in total bubble volume per virion over the course of two dose series. Each virion measured is represented by a data point. The numbers given are mean values. (A) A dose series with 10 seconds between exposures. Upper data points (means, 91 -550 nm3): core-associated bubbles. The number of bubbles nucleated varied between virions and fell during the course of the dose series, through bubble merging. The corresponding data on bubble diameters are given in Table 1. Lower data points: (means, 33 & 55 nm3): singletons. Few virions had more than one singleton. (B) A dose series with 10 min between exposures, for core-associated bubbles.