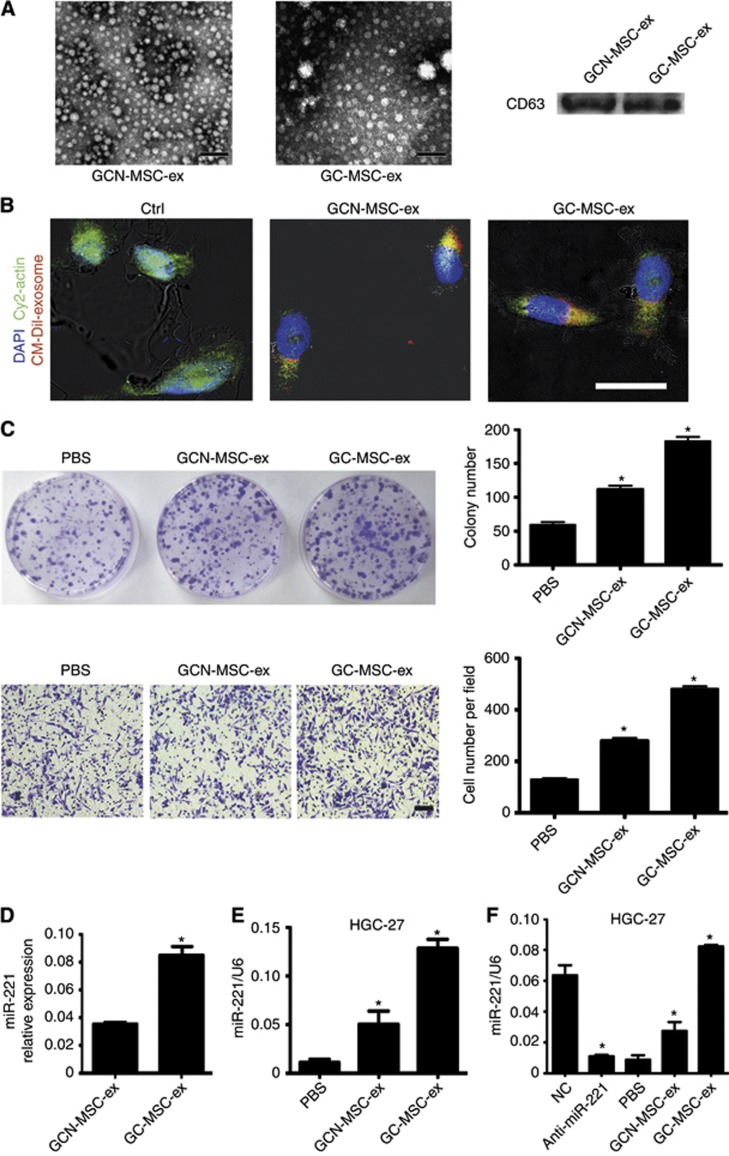
Figure 6.
GC-MSC-exosomes promote cells proliferation and migration via delivering exosomal miR-221 to gastric cancer cells. (A) Representative transmission electron micrographs of purified GCN-MSC- and GC-MSC-derived exosomes (GCN-MSC-ex, GC-MSC-ex), which showed a spheroid shape. The scale bar represents 100 nm. Western blotting results indicated the positive expression of the CD63 protein in exosomes. (B) Exosomes were internalised by gastric cancer cells. Exosomes labelled with CM-Dil (red) were added into HGC-27 cells and incubated for 4 h. The effluent from a filtered suspension of CM-Dil-labelled exosome and the CM-Dil-labelled withdrawn exosome fractions were used as controls. Cells were fixed and stained for cytoplasm (cy2-actin, green) and nuclei (DAPI, blue). Magnification, × 400. Scale bar=25 μm. (C) GC-MSC-exosomes promoted HGC-27 proliferation and migration. Colony formation and transwell migration assay of HGC-27 cells treated with GC-MSC-ex, GCN-MSC-ex or PBS. Colonies and migrated cells on the lower layer were stained and photographed. Magnification, × 100. Scale bar=50 μm. *P<0.05 (GCN-MSC-ex vs PBS, GC-MSC-ex vs GCN-MSC-ex). (D–F) GC-MSCs alter the miR-221 level in gastric cancer cells via delivering exosomal miR-221. (D) Quantitative RT–PCR analysis of miR-221 levels in GC-MSC-ex and GCN-MSC-ex. *P<0.05 for GC-MSC-ex vs GCN-MSC-ex. (E) Quantitative RT–PCR of miR-221 levels in HGC-27 cells treated with MSC-derived exosomes. *P<0.05 (GCN-MSC-ex vs PBS, GC-MSC-ex vs GCN-MSC-ex). (F) HGC-27 cells transfected with anti-miR-221 were treated with different exosomes from MSCs for 48 h. The miR-221 levels in HGC-27 cells were determined using qRT–PCR. *P<0.05 (NC vs anti-miR-221, GCN-MSC-ex vs PBS, GC-MSC-ex vs GCN-MSC-ex).

