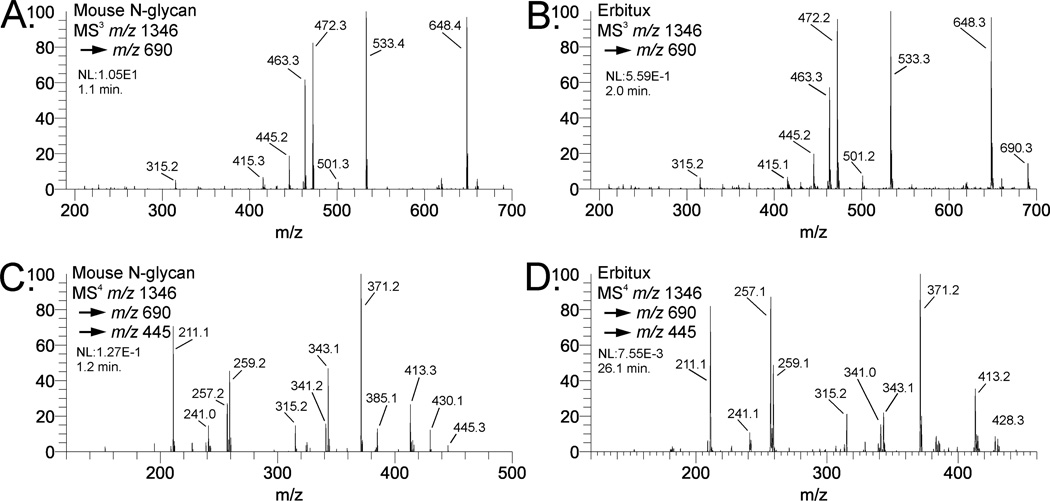
Fig. 3.
Comparison of mass spectra of Gal-(α1,3)-Gal-(β1,4)-GlcNac B-type trisaccharides and Gal-(α1,3)-Gal B-type disaccharides. Spectra in (A) and (C) are N-glycans isolated from a mouse. Spectra in (C) and (D) are N-glycans isolated from Erbitux. Structures and fragmentation are shown for the Gal-Gal-GlcNAc B-type trisaccharide (E) and the Gal-1,3-Gal B-type disaccharide (F).

