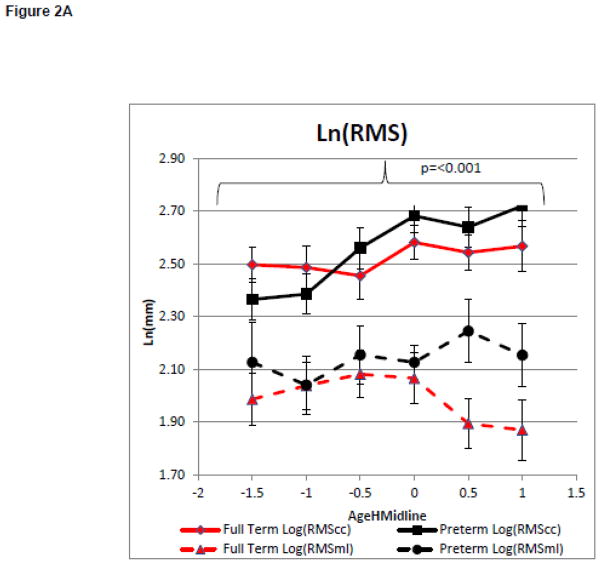
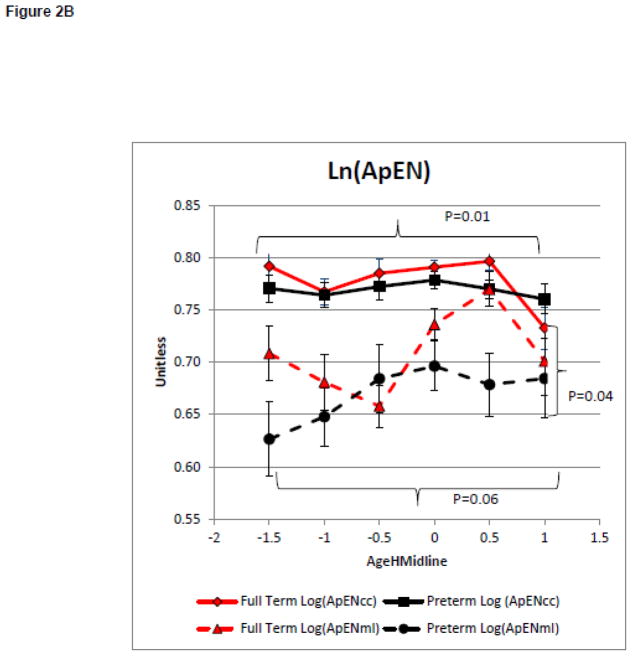
Figure 2.
Model 1: Postural Control Assessment During Emergence of Head in Midline.
Curves represent the average of the dependent variable for each group. Error bars represent the standard error of the mean. The negative AgeHeadMidline values represent the time when the infant was attempting the skill but was unable to meet to criterion and the positive values represent the month after meeting the criterion.
2A: Magnitude of the Variability of COP Displacement
2B: Complexity of the COP Time Series


