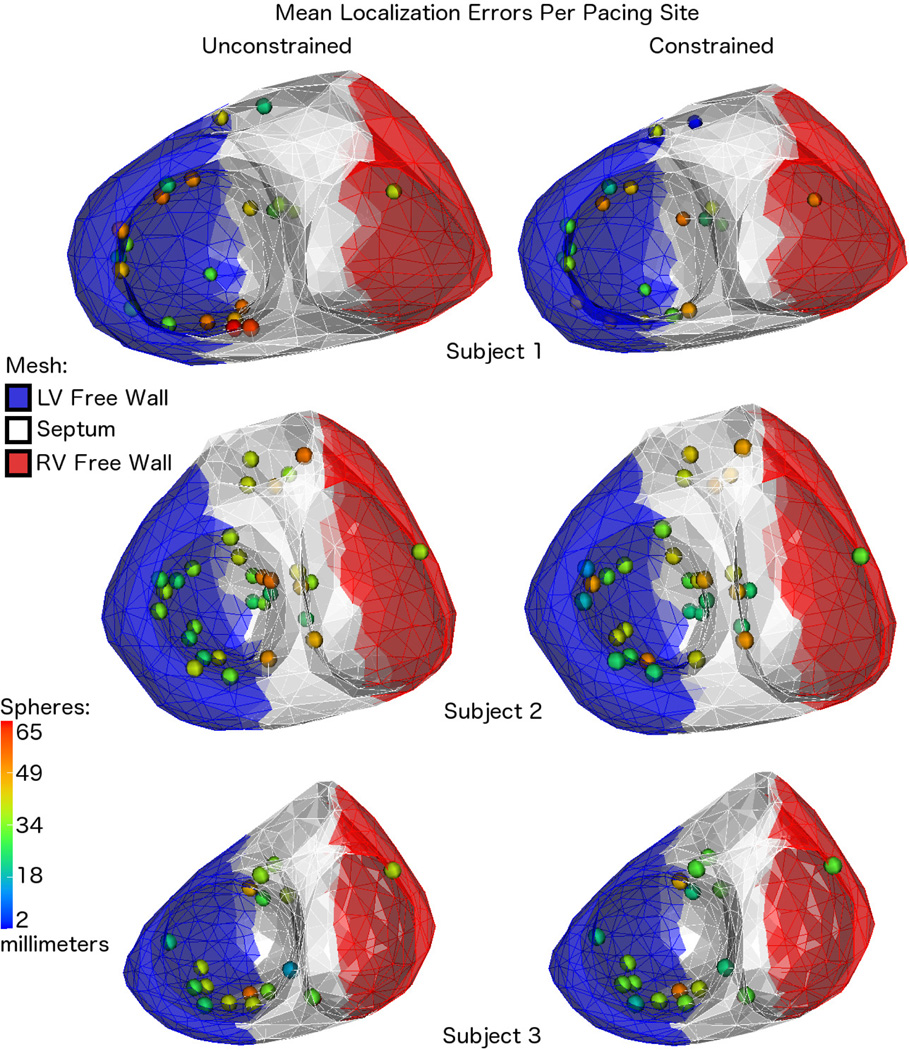
Fig. 4.
Mean Errors By Pacing Location: visualizations of the pacing site locations and the mean localization errors for all three subjects, which are also reported in Tables I, II, and III. The colors of the mesh show the rough segmentation of each of the hearts into three segments using cutting planes: the left ventricular free wall (blue), septum (white), and right ventricular free wall (red). These are the segments used to group the pacing locations for the statistics reported in Table IV.

