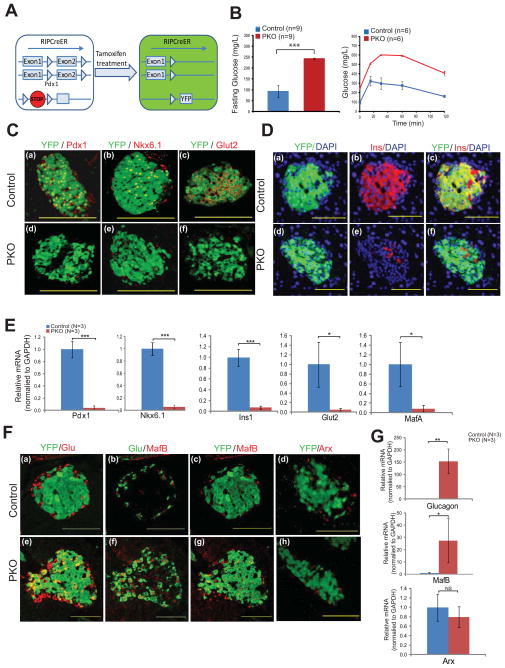
Figure 1. Adult islet β-cells lose their identity and acquire islet α-like features following Pdx1 deletion.
(A) Schematic showing the strategy for Pdx1 deletion and lineage tracing. Mice with a “floxed” allele of Pdx1 and a Cre-sensitive YFP reporter were crossed to RIP-CreER mice. Treatment of animals with tamoxifen (TAM) resulted in simultaneous deletion of exon 2 from both copies of Pdx1 and permanent heritable labeling of the cell with YFP. Mice having one “floxed” and one wild-type allele of Pdx1 were used as controls for all experiments.
(B) Fasting blood glucose levels and glucose tolerance tests performed 4 weeks after TAM administration to 4 week-old mice with two “floxed” copies of Pdx1 (“PKO” mice) or controls.
(C) Immunofluorescent images taken 4 weeks after TAM administration showing loss of Pdx1, Nkx6.1, and Glut 2 in PKO cells compared to control. Note the persistence of Pdx1 in some YFP− cells from PKO islets (but the complete absence of staining in YFP+ cells), indicating that YFP is a reliable reporter for Pdx1-deleted cells.
(D) Immunofluorescent images taken 4 weeks after TAM administration showing loss of insulin (Ins) in PKO cells compared to control. Note the lack of insulin staining in YFP+ cells from PKO islets.
(E) Relative abundance of transcripts encoding β-cell genes (Pdx1, Nkx6.1, Ins1, Glut2, MafA), as measured by qPCR following islet isolation and single-cell sorting of YFP+ cells from control and PKO islets (n=3 animals each group).
(F) Immunofluorescent images taken 4 weeks after TAM administration showing expression of glucagon (Glu) and MafB, but not Arx, in YFP+ cells in PKO islets. In control islets, YFP staining does not overlap with Glu, MafB, or Arx staining.
(G) Relative abundance of transcripts encoding α-cell genes (MafB, Glucagon, Arx) as measured by qPCR following islet isolation and single-cell sorting of YFP+ cells from control and PKO islets (n=3 animals each group).
Bar graph data are presented as mean +/− standard deviation (SD) in this and subsequent figures. *p<0.05; **p<0.01; ***p<0.001 by 2-tailed Student’s t test.

