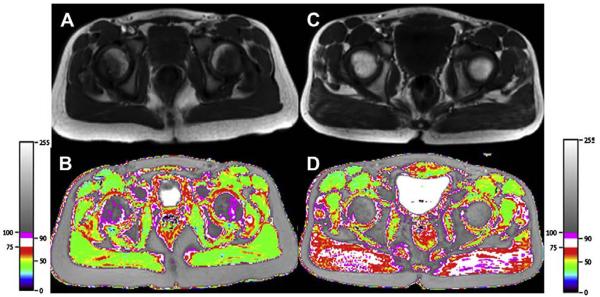
Figure 10.
T2 mapping in a 7-year-old healthy boy (left) and a boy with DMD (right). T1-weighted MR image demonstrates minimal degree of fatty infiltration of gluteus maximus muscles in the healthy boy (A) and the boy with DMD (C). Both boys were graded as grade 1 fatty infiltration on T1-weighted MR images. T2 relaxation time mapping, however, demonstrates a significant difference between the two boys. T2 map demonstrates increased T2 relaxation times within the gluteus maximus muscles in the boy with DMD (D) in comparison with those of the healthy boy (B).

