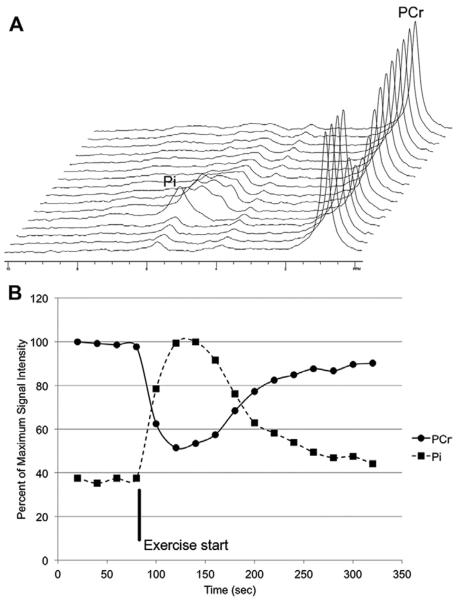
Figure 25.
(A) Series of spectra acquired from the tibialis anterior before, during, and after plantar flexion of the foot. Time increases along the axis running toward the back. The increase in inorganic phosphate (Pi) and decrease in phosphocreatine (PCr) are clearly visible. (B) Signal intensities over time for Pi and PCr extracted from the spectra in (A).

