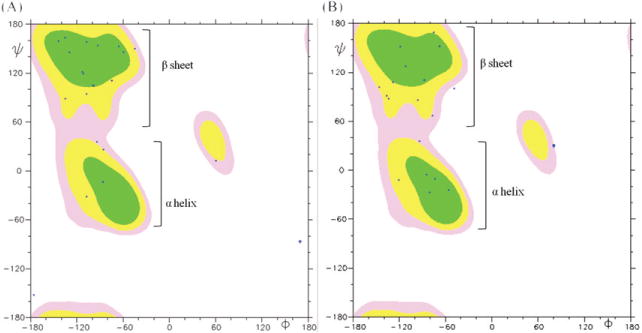
Figure 3.

The Ramachandran plot of average conformations for 20 x4-2-1 and x4-2-9 structures determined by NMR. The MOLMOL 2K.1 software was used for analysis. Phi (ϕ) and psi (ψ) angles of most residues in both x4-2-1 (A) and x4-2-9 (B) structures are positioned in the β-sheet region, except those for residues involved in hairpin bending and the C-terminal helix. This plot shows that monomers of x4-2-1 and x4-2-9 adopt a β-hairpin conformation.
