
Figure 5.
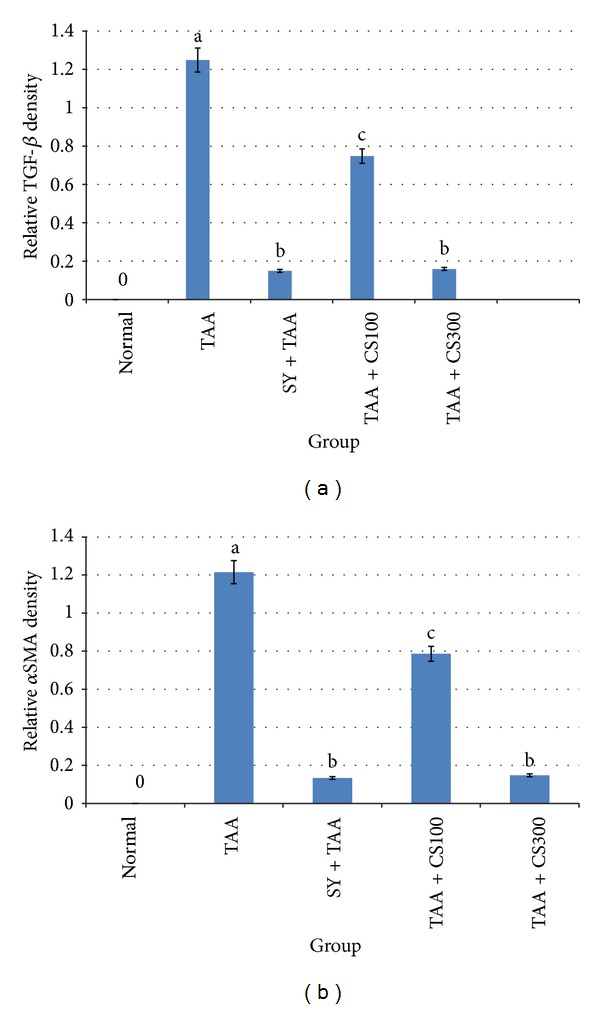
Protein expressions from western blots in all experimental groups are quantitated using Image J program. (a) TGF-β1 density. (b) αSMA density. The data were stated as mean ± S.E.M. (n = 3). Means with different superscripts are significantly different. a P < 0.05 versus normal control group and b P < 0.05 versus TAA control group. SY stands for Silymarin (standard hepatoprotective drug).