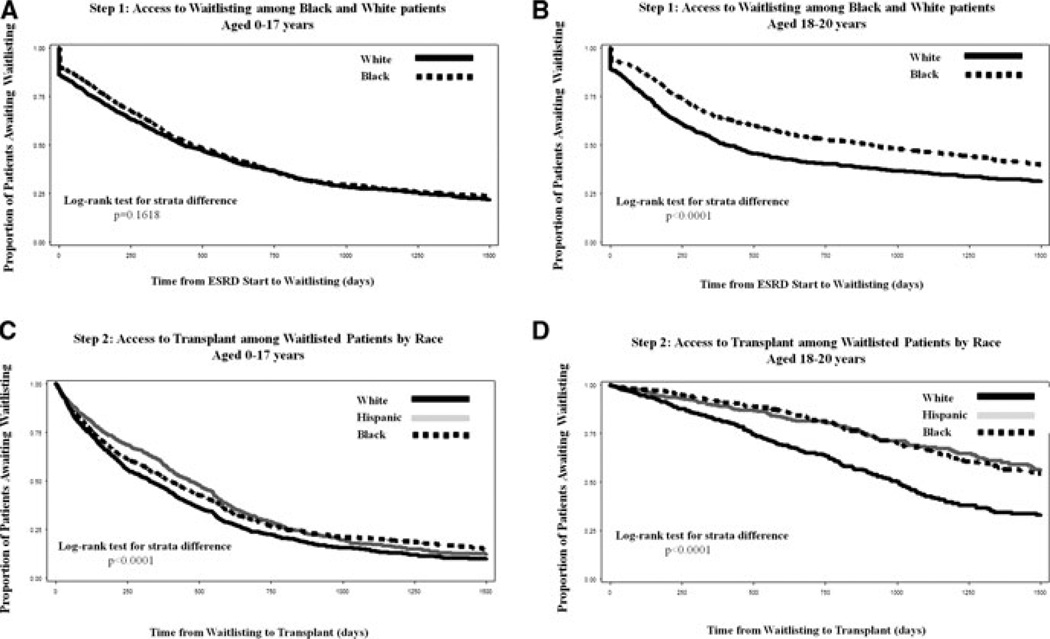
Figure 1. Kaplan–Meier estimates for time to waitlisting (step 1) and deceased donor renal transplantation (step 2) by race/ethnicity and age group.
The rate of waitlisting (step 1) was lower among black versus white patients age 18–20 years (p < 0.0001) and the rate of transplant (step 2) was lower among blacks and Hispanics of all ages (p < 0.0001).

