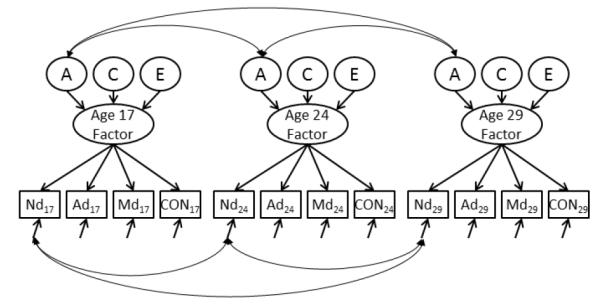
Figure 1.

Longitudinal Factor Model. Part of the longitudinal factor model is shown here. Nd = Nicotine Dependence; Ad = Alcohol Abuse/Dependence; Md = Marijuana Abuse/Dependence; CON is the MPQ subfactor of Control. Separate models were fit for each of constraint, Traditionalism, Control, and Harm Avoidance. Manifest variables are shown in boxes, factors are in ovals, and the ACE components are in circles. For each age the covariance among measures were modeled by a single factor. The variance of the factor is then decomposed into A, C, or E, and those are allowed to covary across all ages. To keep the figure legible, we show covariances only for the A component; in reality the C and E components also covaried over time. Within-measure residuals are also allowed to covary. Again, for simplicity we show only one within-measure across-age covariance, that for Nicotine Dependence. The same residual covariances were estimated for alcohol, marijuana, and the MPQ measure.
