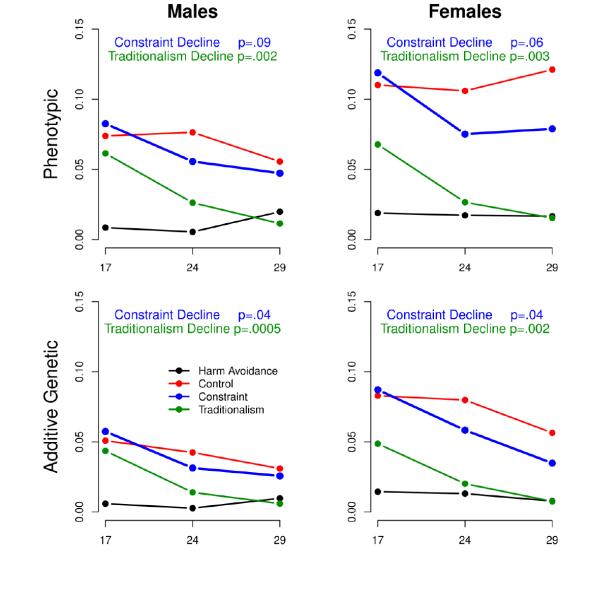
Figure 3.
Age-Related Change in MPQ Loadings on the Substance Use Factor. Males are shown in the left column and females in the right column. Numbers within each panel are p-values corresponding to the change observed across age. The p-values are color-coded (e.g., a green p-value gives the significance of decline in Traditionalism). The additive genetic contribution is scaled such that adding it to the shared environment and non-shared environment contributions produces the phenotypic correlation. Non-shared and shared environmental contributions showed no significant declines, and therefore are not shown here.

