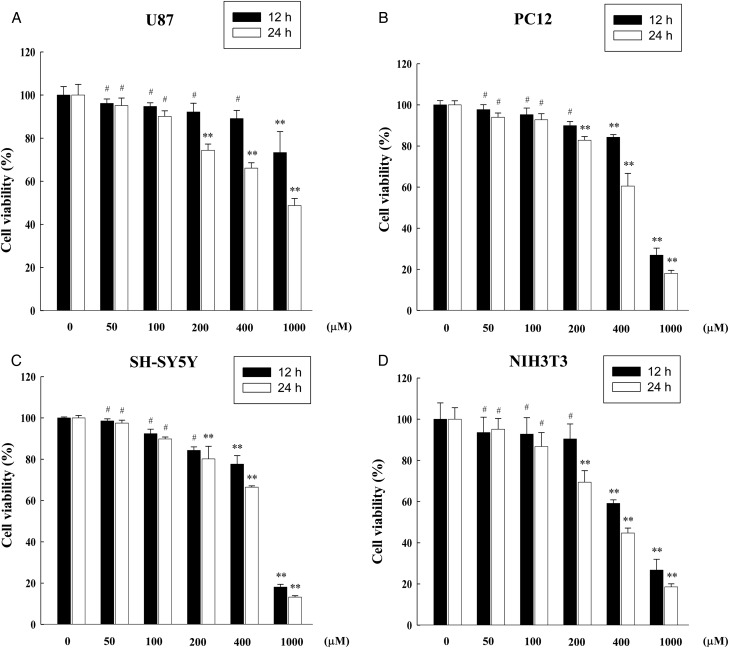
Fig. 3.
Cell viabilities of H2O2-treated neuronal cells. Cell viability was measured by MTT assay in U87 (A), PC12 (B), SH-SY5Y (C), and NIH3T3 cells (D) at 12 and 24 h after different doses of H2O2 treatment (0, 50, 100, 200, 400 and 1000 µM). The data are shown as the means of six independent experiments together with the standard deviations of the means (M ± SD). Statistical calculations were performed by ANOVA via the Tukey post hoc test. The statistical significance value was **P < 0.01, compared with the untreated control at the same time-point. # indicates non-significance (P > 0.05). The presented significances were selected from multiple comparisons.

